WT500 Mid-Range Power Analyzer


The WT500 Power Analyzer excels at single- and three-phase power measurements. Standard features include a color TFT display and USB interface for communications and memory. The instrument has a basic power accuracy of 0.1%, maximum inputs of 1000 V, 40 A and a measurement bandwidth of DC to 100 kHz.

Highlights
- Simultaneous measurement of voltage, current, power, and harmonics
- High-speed data updating (100 ms)
- Display of numerical values, waveforms and trends
- Measurement of bought and sold watt hours
- Easy setup and operation
Voltage range: 15 to 1000 V
Basic Power Accuracy: 0.1%
frequency range: DC 0.5 Hz to 100 kHz
Key layout offers intuitive control
- Cursor Keys
Cursor keys can be used to move the on-screen cursor in four different directions. The cursor keys and SET key can also be used for making selections in soft menus. The WT500's menu structure is even more user-friendly than other models. - RANGE Keys
The RANGE keys can be used to set the voltage and current ranges. Quick intuitive range control is available by using direct keys. - DISPLAY Keys
DISPLAY keys can be used to switch between numerical values, waveforms, and other displays. The display format can easily be changed. - SETUP Key
The SETUP key can be used to enter various settings required for power measurement such as the wiring method and filters. - FILE, IMAGE, and STORE Keys
The keys related to data storage are located in the same area. Data can be easily stored to USB memory.

Features
- Simultaneous measurement of DC and AC signals
Evaluation of DC/AC signal conversion technology is critical in the renewable energy market. With input from 2 or more elements, the WT500 can measure DC and AC signals simultaneously and calculate input-to-output efficiency. - Separate integration functions for charge/discharge and bought/sold power
The WT500 is equipped with integration functions that can not only evaluate charge and discharge current such as from secondary cells, but also bought and sold power in photovoltaic power generation systems. - Saving measured data directly to USB memory
Measured data can be saved in CSV format directly to USB memory. - Easy setup with cursor keys
Menu-type screen offers intuitive setting. - Simultaneous measurement of normal data and harmonic data with the harmonic measurement, /G5 option
RMS voltage, RMS current, power values, and harmonic components up to the 50 order can be measured simultaneously. - WT series for power evaluation of energy-saving equipment
The WT series have been used as powermeters for Green IT, Energy Star, CO2 reduction and other energy-saving equipment. The WT series-Including the WT500--supports your power evaluation needs.
Newly Designed Architecture

Intuitive control by using cursor keys in four different directions.
To reduce setting errors, menus display settings in order of relative importance in order.
Measured Value Direct Save Function

Two USB ports for peripherals are installed for direct data saving (up to 1 G byte) in USB memory at shortest intervals.
The saved data can be opened in applications such as Excel.
* Excel is a registered trademark of Microsoft Corporation in the U.S.A.
A Variety of Display Formats

In addition to numerical data, the WT500 can display input signal waveforms and trends (time variation of numerical data).
Bar graph display and vector display are also available with the harmonic measurement (/G5) option.
*1 Waveforms of up to approximately 5 kHz can be displayed.
*2 Excludes single-phase models.
Split screen display for numerical values and waveforms is not available.
Simple Setting and Display of Efficiency
|
Two efficiency calculations can be set by selecting input elements or output elements from a list. |
Example: η1 = PΣ/P1 x 100% η2 = PΣ/P2 x 100% |
USB Memory Storage Function
Only necessary items within the measured data like voltage, current, and power can be saved in USB memory in binary or CSV format (up to 1 GB).
Files saved in CSV format can be opened in general-purpose applications such as Excel to allow displaying of data in graphs.

Variety of Integration Functions
In addition to integration functions of active power (WP), current (q), reactive power (WQ), and apparent power (WS), a new feature provides measurement of bought and sold watt hours. Also, average active power can be calculated over an integration interval.
This feature is useful for evaluating the power consumed by intermittent-control instruments in which the power value fluctuates. Average active power is calculated by using user-defined settings.

GP-IB Communication (/C1)
GP-IB communication enables you to control the WT500 or transfer data from a PC.
Ethernet Communication (/C7)
Data can be transferred via Ethernet* communication.
It enables file transfers using an FTP server.
* 100BASE-TX

External Current Sensor Input (/EX1, /EX2, /EX3)
Current can be measured by using current clamps without disconnecting power supply wiring (voltage output type). By setting an external current sensor conversion ratio, it can support various types of current clamp-on probes.
VGA Output (/V1)
By connecting to a monitor, you can create large displays of numerical values and waveforms. This function is convenient for simultaneously confirming data on multiple monitors, or to check data remotely.
Harmonic Measurement (/G5)
This function enables simultaneous measurement of normal and harmonic data. Harmonic components of up to the 50th order can be measured. With the WT500 you can simultaneously confirm voltage, current, and the distortion factor (THD) as well as measure the distortion factor without switching modes.
 |
 |
|
| Harmonic Dual List | THD measurement |
Delta Computation (/DT)
This function allows you to calculate individual phase voltages and phase currents from the line voltages and phase currents measured in a three-phase, three-wire (3P3W) system. The phase voltage can be calculated from the line voltage measured with the three-phase, three-wire (3V3A) method. This is useful when you want to determine the phase voltage in a DUT with no neutral line by using the three-phase, three-wire (3V3A) method.
Note: This function cannot be installed on products with only one element.
Added Frequency Measurement (/FQ)
In addition to the standard two channels of frequency measurement, an option is available for frequency measurement on all channels. This option provides frequency measurement of voltage and current on all channels with input elements 1 through 3 installed.This is necessary when you want to measure voltage and current frequency from the instrument's I/O as well as voltage and current frequencies of multiple items under test at the same time.
Note: This function cannot be installed on products with only one input element.
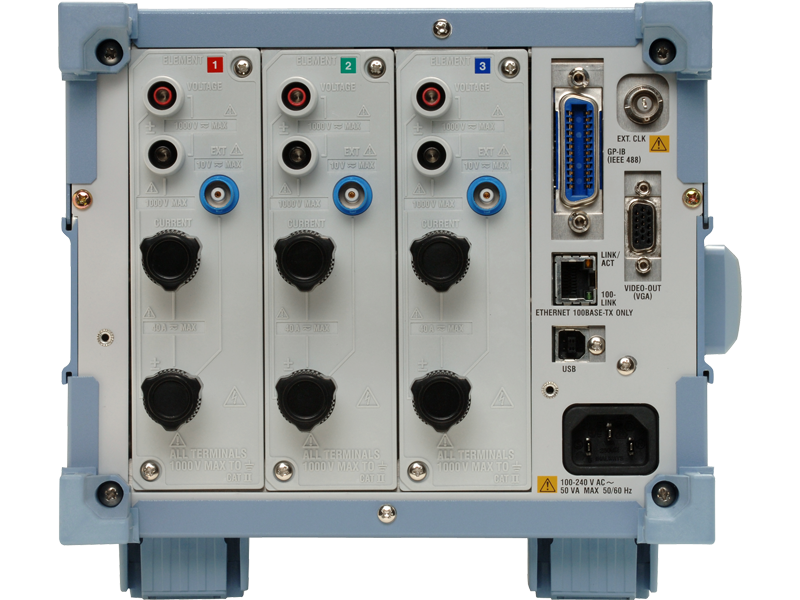
Rear Panel

Standard features
- Voltage input terminals
- Current input terminals
- USB communication interface
- External trigger Signal, External clock input Connector
Optional features
- External Current Sensor Input Terminals (/EX option)
- GP-IB communication Interface (/C1 option)
- Ethernet Port (/C7 option)
- VGA Output (/V1 option)
Characteristics
Example of basic characteristics showing the WT500's high precision


Connection Diagram
Connection for the Measurement Cables and Adapters

| Product | Part no. | Specifications | Order quantity |
| Output connector | B8200JQ | D-SUB 9-pin, with 2 screws | 1 |
| Load resistors | B8200JR | 10 Ω, 0.25 W x 4 Connect 4 in parallel to set resistance to 2.5 Ω. |
1 |
Connection Diagram for Clamp-on Probe

*Don't connect and use the current input terminal and EXT terminal simultaneously.

Photovoltaic power generation has gained attention in recent years, largely due to a new sense of urgency regarding the prevention of global warming.
Wind power is a renewable energy source that is being aggressively promoted (particularly in Europe) in order to reduce emissions of the greenhouse gasses that are responsible for global warming
To evaluate AC adaptors, engineers must acquire the voltage.

With increased focus on reducing energy consumption and compliance with efficiency standards, this app note provides an overview on the types of measurements needed for efficiency and power quality, and the instruments that take them.

Energy consumption in low-power and standby modes is an important issue due to increased awareness that energy resources are becoming limited and demand for energy-saving household electrical appliances continues to grow. IEC62301 Ed2.0 (2011) and EN 50564:2011 define standby mode as the lowest energy consumption of an appliance not performing its main function, when connected to the mains. IEC62301 Ed2.0 (2011) defines test methods and requirements for both the mains supply and the test equipment. It is crucial that design and test engineers choose highly accurate power measurement tools to confirm that their devices meet these requirements.

- Power consumption/quality measurements for product design and test
- Design, compliance, and customer information
- Best practices
- Instruments and components

Prevention of global warming has become an issue in recent years, and industry is turning more and more toward stricter energy savings policies and the use of renewable energy.
In recent years the buzzword "all electric" is becoming popular, which refers to kitchen appliances, water heaters, and other devices in the home all being supplied with electric power.
These days people are talking about the problem of energy depletion, and the industry is turning more and more toward stricter energy savings policies and the use of renewable energy.

Designing an instrumentation system for high current measurement requires careful consideration of the trade-offs associated with each type of sensing device. The purpose of this application note is to help engineers understand the sensing choices available and the corresponding trade-offs with each technology.


The objective of this paper is to show the close relationship between efficiency and power quality, and provide education on the causes of power quality, types of power quality issues, and provide guidance on measurement considerations.
Check for differences in the specifications or features of the instruments. For values that do not match when inputting a 50/60 sine wave Check whether the value is within the specifications (error) of each power ...
The Precision Power Analyzer WT3000 D/A output terminal is electrically isolated from the case. For all other models, the D/A output terminal is connected to the case.

The difference in measurement values can be attributed to the difference in calculation methods for normal mode and harmonic mode. The voltage, current, and power in normal mode are displayed as the total of the ...
The peak value and crest factor may be unstable if they have not been captured accurately. If the peak value is not stable, neither will the crest factor be stable. The cause is the difficulty in capturing the narrow ...
In the three-phase three-wire, or 3V3A wiring scheme, the phase angle of voltage and current input to each input differs from that of the actual load because it is the line to line voltage that is measured. In ...
- Power Analyzer/Power Meter
- In the case of three-wire, or 3V3A wiring, or three phase power source, they do not match because it is the line to line voltage that is measured
Check for differences in the specifications or features of the instruments. For values that do not match when inputting a 50/60 sine wave Check whether the value is within the specifications (error) of each power ...
The measurement intervals of the measured I/O data must overlap exactly. Check the sync source setting. For example, route the input to a three-phase device under measurement to input elements 1-3 on the power meter, ...
The value depends on the model of the power analyzer. For Precision Power Analyzer WT1000, WT2000, WT100, and WT200, it is fixed to the fundamental wave. For power analyzers with 7 segments LED, the relative harmonic content is fixed to the ...
The actual display update rate for the WT500 Power Analyzer will depend on the input signal and the trigger setting. In addition, there may be a very small trigger delay (several milliseconds) if the input signal does not match the ...
Check the Synch Source and Frequency Filter settings When a single-phase signal being measured fluctuates around power factor of 1.Slight fluctuations in the measured values of voltage, current, and power can cause a ...
The following may be causing the problem. 5V may have occurred during rating. Check the range setting again. DA output error can affect the values when the input is smaller than the rating. Have you checked the error ...
To use USB interface on the WT500 and WT1800 Power Analyzer from NI LabVIEW environment, you will need to use the USB driver from National Instruments. This USB driver is usually installed when you install NI-VISA and is called the ...
When the WT1600 Digital Power Analyzer is set into Integration mode, the averaged power (watt) values can be calculated and displayed. This is available only by using the User-Defined Function feature found in the MEASURE button menu. The ...
You can not use LabVIEW and WTviewer to communicate with the PC using same USB driver. The USB driver for LabVIEW and the USB driver for WTviewer is different. Yokogawa's YKMUSB driver is used by WTviewer ...
- Power Analyzer Accuracy and Basic Uncertainty Calculator from Yokogawa Test&Measurement
- Determine uncertainty in voltage, current, and active power (watts) measurement values
- Various frequency ranges and wiring systems
- Check the "Sync Source" and zero cross filter (frequency filter) settings.
- For the WT3000, "Sync Source" setting is irrelevant if the data update rate is 250 ms, 500 ms, 1 s, or 2 s.
The waveform may actually not be a pure sine wave. Even though a 50/60 Hz sine wave is expected, the following factors may be involved: The waveform is slightly distorted (harmonic components are mixed in) Small ...
- Power analyzers/power meters
- Binding posts on the direct current input terminals
- Prevent an open current circuit and safety hazards
- WTViewer Save Setting feature will only save WTViewer setting information
- Will NOT save the setting information of the instrument
The AC Power Input in all Yokogawa instruments is designed as a 3-pin connection (one of which is a GND pin). In some parts of the world, PCs are sold with AC power cables that are 2-pin. Often times this means the ...
- WT1800 High Performance Power Analyzer, WT500 STORE functions can only be used to record NUMERIC data
- WT1600, WT3000 STORE functions can be used to record both NUMERIC and WAVEFORM data
- Current Knobs and Pads (Studder) Used on the Direct Input Terminals of the WT500 Part Numbers
- A9105ZG: Black Current Knob Set of 2 B9292GX: Pad (Studder) Set of 10
Although WTViewer is not officially supported under the Linux environment, users have successfully done so using WINE (flavor of Linux) via RS232. For connectivity to WT210/WT230, WTViewer requires that the meter be set ...
Yes, please contact your nearest Yokogawa representative for more details.
The following product tutorial guides have been created for the WT and PZ Series Power Meter and Analyzer instruments and are available for download. Each tutorial contains quick and easy steps to help you get started ...


This training module covers the following topics:
- Introduction & Installation
- Connecting to Instrument
- Setup, Measure, and Analyze
- File Operations: Saving and Loading Data
- Video Demonstrations

10-video training series from Yokogawa Test&Measurement that covers the basics of power analyzers including an overview of our power analyzers, their theory, wiring, filters and sync source, and voltage and current ranges.

I’ve been using Yokogawa Test&Measurement instruments for power measurement and analysis for several years and they always get the job done. They provide extensive and thorough documentation for their equipment and their drivers are very handy. Features like screengrabs of test results for easier sharing and the remote interface (which minimizes the time we spend having to automate tests) have proven to be incredibly helpful. My team needs instruments that are well documented, easy to use, and reliable. Yokogawa instruments check all these boxes.
—Power Drive Systems Electrification Validation Test Development, Fortune 500 Leading Global Supplier of Sustainable Automotive Solutions

For standby power measurement and energy certification maintenance, we rely on Yokogawa Test&Measurement instruments. Their precision, accuracy, and ease-of-use are unrivaled. When given a choice between other test and measurement equipment and Yokogawa, our technicians always go for Yokogawa first. The support team provides thoughtful insights based not just on our industry but also our company’s specific needs. My team has used Yokogawa Test&Measurement instruments for decades and will continue to do so well into the future.
—Director of Technology Laboratories, International Multi-Brand Manufacturer of Major Home Appliances
Brochures
- WT500 Power Analyzer (1.7 MB)
- Current Sensors & Probes CT2000A /CT1000A /CT1000 /CT200 /CT60 /751552 (2.5 MB)
Instruction Manuals
- WT500 Power Analyzer (9.8 MB)
- WT500 Power Analyzer Communication Interface (1.9 MB)
- Regarding the WT500 Power Analyzer Communication Interface CD-ROM (83 KB)
- WX1 GateWT User's Manual (859 KB)
- WT series Sample Program (804 KB)
Software
- WTViewer 760122
- WTViewerE 761941
- WTViewerEfree Software
- Power Consumption Measuring Software
- TMCTL
- USB Drivers
- WT500 Power Analyzer Sample Programs
- WT500/ WT1600/ WT1800/ WT1800E/ WT3000/ WT3000E file reader software
- LabVIEW Drivers for WT500 ( NATIONAL INSTRUMENTS Web Page )
Firmware
Drawings
- WT500 Power Analyzer (731 KB)
How-tos


Learn when to use line filters and/or frequency filters while making power measurements with a power analyzer.

Learn how to log power measurement data continuously from a digital power analyzer when connecting it to a data recorder to easily and securely collect and synchronize voltage, current, harmonics, and power data for long periods of time, while also collecting thermocouple, RTD, and standard analog signal, all in one place.
Webinars
- How to avoid the “gotcha's” of inverter-based measurements
- Computations for field-oriented control
- The integration of CAN bus communications
- Correlations in the frequency domain
- Other advanced motor and drive topics

You know the basics of electrical power measurements, have set up your dyno, and made key measurements – which is great. But as your motor and drive projects progress, the complexities of system drive requirements can change frequently. Control algorithms, networked communications, and mechanical systems form a complex web of interactions that need sorting. This 60-minute webinar explains how to get past ground-level measurements and delve into comprehensive solutions that leverage test and measurement instruments including power analyzers, high-speed data acquisition, and real-time software.
Topics include:
The technical presentation includes an audience Q&A.

Why should you be concerned with your product’s power system voltage and current harmonics? From an engineering perspective, harmonics produce excessive heat in equipment that causes significant damage and results in inefficient operation. From a business perspective, compliance is an absolute requirement for entry into global markets. To minimize or eliminate these issues and establish acceptable levels of harmonics, numerous power quality standards with specifications and limits for harmonic distortion, such as IEEE 519-2014 and IEC61000-3-2, have been introduced. During this webinar, attendees will gain knowledge on the inner workings of harmonics, learn best practices for accurately measuring harmonics, learn to recognize and distinguish the critical difference between DFT and FFT, and discover important measurement tradeoffs across various test equipment.
