DL9000 DSO Series (DISCONTINUED)


Winner of Test & Measurement World's "Best in Test" award, the DL9000 offers you the strongest combination of performance, ease of use, and value among digital oscilloscopes in the 500 MHz to 1.5 GHz range. It contains a wide array of analysis functions that include parameter statistics, trends, real time filters, serial bus analysis and power analysis.
DL9000 models are available with 2.5 M points of waveform memory on each of four channels and with an "L" version containing 6.25 M points on each channel. In accumulate mode, the DL9000 overlays up to 2000 acquisitions on the screen that you can scroll through to look for signal peculiarities.
Affordable Performance for 500 MHz/1 GHz /1.5 GHz BW Measurements
The standard DL9000 series is equipped with 2.5 M word/ch record length, dot density display technology and a wide variety of analysis and trigger functions. For full 1 GHz/1.5 GHz BW measurements, optional 2.5 GHz active probes are available. These make the DL9000 series the most affordable 500 MHz/1 GHz/1.5 GHz measurement system available today.
|
Advanced display technology Mask testing
(dot density display) |


DL9000 Trigger Types
History Memory with Fast Signal Acquisition
Fast signal acquisition helps you avoid missing anomalies. However, simple superimposed waveform displays only tell whether or not an anomaly occurred. Such displays do not provide information about when the anomaly occurred, what events occurred before the anomaly, nor what happened after the anomaly. The DL9000's History memory function allows you to view and analyze up to 2000 previously acquired waveforms, even after the acquisition stops. This offers unparalleled insight into waveform behavior and makes troubleshooting easier.
History memory advantage #1: Correlate events from multiple channels

Ex 1: Display shows superimposed history waveforms
(Up to 2000 waveforms can be saved in history memory)
History memory advantage #2: Determine sequence of events

History memory captures and saves waveforms before and after the anomaly; thus providing insight into the cause and effect of the anomaly.
Security for Confidential Tests
The DL9000 series can be configured without the optional internal HDD. For units without the HDD, it is both easy and fast to securely erase all the data in the unit. Therefore, you do not have to worry about your confidential test results being transferred to a different location, along with the unit.
A Small Footprint Means More Room on Your Bench for the DUT
| The DL9000 is only 35 cm wide and 18 cm deep so it does not take up all your valuable bench space. And it weighs only 6.5 kg so it is easy to move from one bench to another. |
 1 GHz oscilloscope depth comparison |
Flexible Acquisitions
 The DL9000 signalXplorer is Yokogawa's 10(X)th generation digital oscilloscope. It allows users to select the most appropriate memory setting for a given measurement and then acquires and displays long and short memory records quickly, saving the waveforms to its segmented memory. Advanced memory handling ensures that you get all the benefits of a long memory scope regardless of the record size you allocate for each acquisition. This is made possible by the state-of-the-art ADSE (advanced data stream engine) ASIC.
Burst signal capture scheme

Example of shorter memory acquisitions (I2C SDA signal capture): by skipping portions of a signal which contain no information, many frames can be acquired in the memory.
Mega word signal capture example (TV composite signal): 1 whole TV frame can be captured without losing detail.
History Replay
When acquisition stops and there are more than two acquisitions in memory, the HISTORY key is illuminated. At that time, you can use the rotary knob to view every single acquisition in memory, one-by-one, and look for an anomaly. The new History Replay function allows you to play back the waveforms in memory in the same way you play back video on a DVR.

 Reviewing each acquisition one by one Reviewing each acquisition one by one |

Playing back history memory continuously
|
ADSE Offers Two Fast Signal Acquisition Modes
N Single Mode
When you need to observe closely-spaced waveform events consecutively, it is important to minimize the dead time between captures. The 'N single' mode on the DL9000 captures up to 1,600 waveforms on each of 4 channels with as little as 400 ns of dead time between acquisitions. In the 500 ps/div range, this corresponds to an effective acquisition rate of 2.5 M waveforms/sec/ch.
New ACCUM (accumulation) mode
When observing long-term repetitive waveform events, the ACCUM function offers a fast repetitive signal acquisition rate of up to 25 k waveforms/sec/ch (on 4 channels simultaneously) while retaining up to 2,000 acquisitions in memory.
Whether you use N single or the ACCUM function, previously acquired waveforms are stored in memory and can be accessed using the History Function.
Search Function
Search function
 Both Zoom search and History search functions are available in the signalXplorer. Zoom search locates an area of interest in a single acquisition. History search locates any acquisition in history memory that meet user-selected criteria.
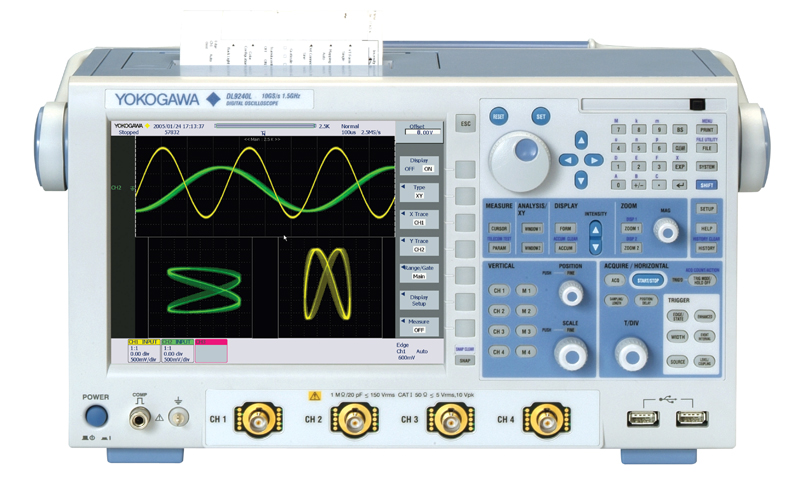
Dot density display
 The intensity of individual display pixels are varied depending on how often a signal illuminates each pixel. Even for single shot acquisitions, Dot Density Display provides visual information about the S/N ratio of a signal. For repetitive signal acquisitions, this feature offers additional insight into the frequency of occurrence of portions of a signal over time. In short, Dot Density Display technology offers analog oscilloscope-like waveform representations on a digital scope.
Enhanced Analysis & Math
Histogram displays

 Gain new perspectives on your waveforms by using time and voltage histograms. For example, signal jitter can be shown using a time histogram, and noise on DC signals can be visualized using a voltage histogram.

Example: result of time histogram
Statistics

 Use the statistics functions to generate statistical information (max, min, avg, std dev, etc.) about waveform parameters. Continuous statistics (running statistics on selected parameters during acquisition), Cycle statistics (statistical information about a waveform on a cycle-by-cycle basis) and History statistics (statistics on waveforms captured in history memory) are all available.

Example: cycle statistics
FFT
 The DL9000 series can calculate FFT waveforms using up to 250 k points. To scale the results, you can specify the center frequency and the frequency span, just like you would do with a spectrum analyzer.


250 k point FFT Scaled FFT result
Trend displays
 Track long-term waveform parameter trends using the trend display. The Trend display can be used to visualize fluctuations of a selected parameter.

Example: Trend display of P-P values
Mask testing
 With free Mask Editor Software, you can define a mask and then test to see whether or not the measured signal falls in/out of the mask. Masks for a variety of communication signals can be defined.


Example: Telecom test Example: Mask Editor Software
Waveform math

 Define up to 8 math traces. Functions include: filtering, +, -, x, Integration, Edge Count and Rotary Count. Basic arithmetic functions are performed using the ADSE (hardware) and results are displayed in real time.
Waveform math

Math trace example
Real-time analog/digital filtering
 Real-time filtering 200 MHz and 20 MHz analog low pass filters and 8 MHz, 4 MHz, 2 MHz, 1 MHz, 500 kHz, 250 kHz, 125 kHz, 62.5 kHz, 32 kHz, 16 kHz and 8 kHz digital low pass filters are available for real-time filtering. These filters can be applied to live signals without slowing down the signal acquisition rate. Additional types of digital filtering are available using the math function.


Signal without filter Signal with filter
Connectivity
Use USB 2.0 interface (standard), 100BaseTX /10BaseT (option), or GPIB (available using a National Instruments NI PCMCIA-GPIB card) to remotely control the DL9000 and to transfer waveform data from the scope. The industry standard USBTMC-USB488 with USB 2.0 interface offers data transfer rates that exceed typical GPIB data transfer rates.
For data storage, you can use a PC card drive (available in both front and rear panels) or USB interface. These interfaces support media such as CompactFlash, PC Card type II HDD, and USB memory
Connectivity


GPIB interface
(Two PC card interfaces are standard. However, a NI PCMCIA- GPIB card is required for communication. You can use the front or back panel PC Card interfaces for this purpose.)
PC Card/USB interfaces
 |
 |
 |
Use popular, widely available, large capacity media such as CompactFlash or USB HDD to save and transfer waveform data captured with the DL9000.
A USB mouse and/or keyboard can be used to facilitate operation of the unit. The front USB port can also be used to connect to a USB printer.
Comes Standard with a Wide Variety of Dedicated CAN Bus Triggers
--- CAN Bus Signal Analysis Function (/F7, /F8 Option) ---
Dedicated triggers for CAN Version 2.0A/B (high speed and low-speed CAN bus signals; used extensively for the internal busses of automobiles, factory automation equipment, medical devices, and other application) and CAN bus signal protocol analysis function are available as an option on any DL9000 series instrument. A number of triggers and powerful analysis function for CAN bus come together in a instrument. Two models of differential probes are available for CAN measurements (sold separately).
 The DL9000 applies triggers based on a variety of specified conditions, enabling reliable capture of only the desired CAN bus signals. It offers Start of Frame, ID, and Data conditions, combinations of these conditions, and Remote Frame and even set up to four CAN ID/Data conditions, combined with OR logic, and trigger if any of the conditions occur. You can also set conditions relative to a specified trigger Data value such as True/False, Greater than/Less than Data value, between two(2) data values, or out of Data range.
Combination Triggers
 |
Combination Triggers: Create triggers consisting of CAN events and events on other channels (Event Interval Trigger) |
|
Supports System Debugging and Troubleshooting
(with High Speed Analysis & Waveform Display)
The CAN bus protocol analysis results list can be displayed while the waveforms are being acquired. Analysis results of frame type, time from trigger position, ID, DLC, Data, and CRC, and Ack/Non-Ack are aligned in a single screen with their corresponding waveforms, enabling you to easily compare waveform quality and bus protocol together. You can capture waveforms and analyze the data in real time at update rates of approximately fifteen times per second.* You can save the analysis results (list) to a text file in CSV format.
* During continuous measurement at 5 ms/div and a record length of 1.25MW.
(Update rates will vary, depending on setup conditions.)
 Waveform Display and Analysis Results |

Detailed Analysis Results
|
Simultaneous Analysis & Display of Tow Different CAN Bus Signals
 You can analyze two CAN bus signals simultaneously and display the results.
For example, you can check waveforms and protocol data from two CAN sub-networks with different condition at the same time, and verify the correlation between the signals.
Two different CAN bus signals:
analyzed & displayed
simultaneously
Automatically Search Captured Signals for Specific Frames/Fields
 You can perform searches of the captured data by specifying Start of Frame, ID, and Data condition (or combinations of these), and Remote Frame and Error Frame conditions.
When the frames are detected that match the search criteria, the analysis list is highlighted and that portion of the waveform is displayed in the zoom window. You can identify portions of the waveform such as the ID or Data field of a specific frame and display those in the zoom area (Field Jump function).
Field jump function display
Auto Setup Dedicated to Serial Busses(/F5, /F7, /F8)
 Using the Auto setup function dedicated for serial buses, you can have the instrument automatically enter settings for record length, time axis (T/div), triggers, and analysis by simply specifying bus type and source (input) channel. After that, it will automatically display bus waveforms and analysis results (list and decoding). This frees you from tedious analysis setup. |
Serial Bus Analysis: 12C, SPI, UART, CAN*, LINCAN Bus Signal Analysis Function (/F7, /F8)
| DL9000 Series can perform I²C, SPI, UART, LIN and CAN bus analysis with the different available options (/F5, /F7 and /F8). Triggers for these bus types are standard features. These functions make it easy to discriminate between partial software failures and physical-layer waveform problems when troubleshooting systems by observing the physical-layer characteristics of signals.
*: CAN trigger and CAN analysis is supported by the analog input channels. |


CAN Bus Signal Analysis Function (/F7, /F8)
| DL9000 Series is equipped with dedicated CAN triggers including Start of Frame, ID, Data, Remote Frame, and Error Frame. Additionally, you can now set up to four ID and Data combination bit conditions and activate triggers based on OR relationships of these combinations. With the protocol analysis results list which is shown in a time series fashion, you can check each frame's analysis results (frame type, time from trigger point, ID, DLC, Data, and CRC), presence/absence of Ack, and the association with corresponding waveforms in a single screen. You can specify the type and other characteristics of fields and frames and search for corresponding waveforms in the captured CAN frame data. | 
Waveform Display and Analysis Results
|
LIN Bus Signal Analysis (Added to the /F7 and /F8 Option)
| Triggering and analysis functions for LIN bus (widely used as an in-vehicle LAN protocol for car body applications) are available on the DL9000 Series. It is equipped with Break + Synch trigger. You can check waveforms and the protocol analysis results (list) along with the error information (Parity, CheckSum, TimeOut, etc.). You can analyze both LIN revision 1.3 and 2.0 conformity data existing on the same bus line simultaneously.
* LIN bus analysis function supported with firmware version 2.40 or later (/F7 or /F8 option). |
 Simultaneous analysis and waveform (decode) display of CAN and LIN bus signals |
I²C and SPI Bus Analysis (/F5, /F8)
| This option enables, analysis, and search on I²C and SPI serial data bus signals. Observing the physical signals of these buses allows you to more effectively separate hardware related problems from software related problems. With the new firmware version 4.42 or later, the SPI analysis function without CS(Chip Select) source assignment is available. Some SPI bus applications do not require CS signal. Also, the data field size and the enabled bit range for analysis can be specified. The DL9000 DSO series can be applied for more wide-ranging SPI application. (I²C and SPI triggers are standard) |
 |
UART Signal Analysis (/F5, /F7, /F8)
| General-purpose UART trigger and analysis can be supported. The UART trigger function can trigger on stop bit of each data frame. Analysis number, time from trigger position, binary and hexadecimal notation of data, errors, and other added information can be linked with the waveforms and displayed in the same screen as analysis results. The UART analysis results can also be displayed in ASCII. Grouping display is supported for easy identification of serial messages over 2 bytes. |
||

UART Trigger
|

Grouping displays
|
|
 Example of UART analysis |
||
Built-in Printer (/B5)
 |
This built-in thermal paper printer provides a convenient way to print out what is shown on the DL9000's display. |
Probe Power (/P2)
 |
These ports supply power to the following current probes (701932, 701933) and the following differential probes (701920, 701921, 701922, 700924, 700925) Note: You do not need this option to power the 2.5 GHz active probe (PBA2500).
|
100 Base TX/ 10 Base T Ethernet (/C10)
 |
100 BaseTX/ 10 BaseT Ethernet (/C10)
Network file server/client functions and network printing are supported through Microsoft network file sharing. The SMTP client allows you to send e-mail from the unit. (/C10) |
Power Supply Analysis Function (/G4)
Parameter Measurements and Statistical Computations
for Power Supply For Example: Power and Power Factor
Simply select voltage and current channels in a dedicated setup menu to add power-specific parameters to the waveform parameters of the selected channels. See the specifications on the reverse side of this leaflet for the dedicated parameters (types) that are added. You can also calculate the Joule-integral (I²t) required for fuse characterization.

Statistical Computation and Trend Display of Cycle-by-Cycle Switching Loss
| For example, in a active power factor correction circuit running in critical conduction mode, fluctuations in the switching frequency and switching current of the modulating signal, relative to the input voltage of the commercial power supply, can be displayed simultaneously along with the input voltage waveform. The figure on the left shows data from multiple cycles of voltage (Vds), current (Id) and the computed switching loss (Vds x Id) (M1 waveform). Loss can be calculated for each cycle within a specified range of the M1 waveform (the Iteg TY parameter), and the integrated value can be quickly computed. The DL9000 also lets you view cycle-by-cycle switching loss in a list or as a trend line. Variations between power on and steady operation can easily be seen. |
 |
Measuring Switching Loss with HIstory Statistics
| With high speed acquisition (max. 2.5 million waveforms/sec.) and the history statistics function, you can compute statistical values and total loss of the switching loss waveforms across multiple intervals. By specifying a computation range, you can also compute the loss when switching ON and OFF, separately.
The number of history waveforms (Cnt = number of switching cycles) and their statistical computation results are displayed in the figure to the right. |
  |
| The difference in the current probe and voltage probe signal propagation time (skew) can be automatically corrected. This is useful for accurate measurement and computation of switching loss. A deskew correction signal source (model 701935, sold separately) is available. |  |
Dedicated Waveform Computations for Power Supply Analysis
| Quickly perform waveform computations of active power, impedance, and Joule-integral (I²t), and display the resulting waveforms. Simply select the desired function and source input channels from the menu to display the computed waveform. |  |
Harmonic Analysis of Power Supply Current Based on EN61000-3-2

User-Defined Computation (/G2)
(The power supply analysis function option (/G4) includes the user-defined math option (/G2).)
|
Four user-defined waveforms can be defined (MATH1-MATH4) and used simultaneously in computations. In addition to a wealth of computation functions, twenty-six measurement parameters can be used in the equations. For example, you can normalize data using the amplitude of a measurement parameter. Up to 6.25 MWords per channel can be computed. Math waveforms can also be used in X-Y graphs, FFT displays, histogram analysis, and other functions.
|
|


/C12 LXI Compliant Ethernet Interface Options

LXI (Lan eXtensions for Instrumentation) is a communication platform for test & measurement instruments, built on LAN technology. It provides improved transfer speeds with improved usability and low cost, when compared to traditional instrument interfaces. It's easy to migrate over from traditional GPIB system, because LXI utilizes existing technologies such as VXI-11 or IVI.
The Yokogawa DL9000/DL9700/9500 series and SB5000, with the LXI compliant Ethernet option (/C12) installed, are fully compliant with LXI Class C.
Currently, over 20 test and measurement manufacturers provide LXI compliant products, and the total number of supported products is above 1100. As a new communication platform for applications requiring high transfer speed, low cost and usability, LXI will become more widespread in the future. For more information on LXI, please visit the LXI Consortium.
| Model | Description |
|---|---|
| DL9040 | 500 MHz BW, 5GS/s, 2.5MP/ch, 4 channel |
| DL9040L | 500 MHz BW, 5GS/s, 6.25MP/ch, 4 channel |
| DL9140 | 1 GHz BW, 5GS/s, 2.5MP/ch, 4 channel |
| DL9140L | 1 GHz BW, 5GS/s, 6.25MP/ch, 4 channel |
| DL9240 | 1.5 GHz BW, 5GS/s, 2.5MP/ch, 4 channel |
| DL9240L | 1.5 GHz BW, 5GS/s, 6.25MP/ch, 4 channel |

While accurate rise time measurements have become easier to make, it remains, nonetheless, quite easy to overlook error contributions due to not only the oscilloscope but also the probe. And, while the error contributed by a scope's finite step-response (rise time) is often accounted for, that contributed by the probe is often overlooked.

The HDMI (High-Definition Multimedia Interface) standard is based on the DVI (Digital Visual Interface) standard. The HDMI standard has addressed the requirements for a next generation visual interface adapted by non PC applications such as DVD players or STB.
Decimation is a technique used to reduce the total number of samples. You can use Xviewer to perform decimation on your waveform data files that have the WDF/WVF/ASCII CSV extension format. Decimation reduces the ...
Please make sure to set Time/Div to a setting which will display a minimum of sixteen (16) Cycles. To setup the instrument for harmonic analysis: Press the WINDOW1 key Press the Type soft key Select ...
- Symbol editor for the DL9000/SB5000/DLM2000 instruments
- Two operating modes: CAN and LOGIC
- See Symbol Editor online software download page
The sanitation procedure for various Yokogawa oscilloscopes have been documented below. Please download the document or pdf that refers to your Yokogawa oscilloscope.
The Yokogawa .SNP file is a proprietary Yokogawa file format for saving waveform snapshots. This file has no relation to the Microsoft Snapshot Viewer program. The .SNP file can only be viewed on the oscilloscope.
There are two methods to programmatically determine if the calculations for waveform parameters is completed on the DL series oscilloscopes. Send the :MEAS:WAIT? command. This will ensure that no other commands are ...
Yes, the HDMI pinout carries the I2C on pins 15 and 16 of the HDMI connector cable. The HDCP (content protecting encryption keys) signal is carried on pins 15 and 16.
Any DL9000 Digital Oscilloscope with firmware version 1.82 or older will require a one time upgrade via FAT-16 PC Card. After applying the one time upgrade, any subsequent new firmware update can be performed via USB flash drive. Please see ...
To use wireless mouses or keyboards on a device, a driver needs to be installed. Yokogawa instruments will not let you install drivers on the device, therefore it is not possible to connect a wireless mouse or ...
Please download the attached article. This article discusses the three types of display interpolation found in the Yokogawa DL9000 and SB5000 Digital Oscilloscopes. It is also applicable to other Yokogawa Oscilloscopes.
Currently, the SB5000 and DLM2000 series oscilloscopes provide the CAN Bus symbolic decode analysis function. Once the zooming magnitude is enlarged, the indication appears automatically. The DL9000 does not provide CAN ...
The free software DL-GATE can be used for the following products only:DL1700E seriesDL7400 series (firmware version after 1.32)DL1600 series (firmware version after 1.13)DL750 series (firmware version after ...
When communicating or controlling the DL7400 Digital Oscilloscope via USB in LabVIEW, you must use the USB driver files provided by NI-VISA (Version 3.0 or later). The Yokogawa USB driver files labeled YKUSB or YKMUSB can be used when ...
Frequency to Voltage Conversion Problem: A transducer produces a sine-wave output dependant on the voltage-input; here is how to decode that output with a scope or a ScopeCorder. For 3kV input, the transducer ...
The DLM2000 Series mixed signal oscilloscopes are capable of performing enhanced parameter measurements and calculations. This feature allows you to perform automated measurements of waveform parameters of two different areas. It ...
The DL series instruments are capable of measuring the delay between traces or the delay between channels. The measured output value can be displayed in either time or degree. To setup the DL850 Scopecorder to measure delay, follow ...

- Lowest possible device setting for sample rate on Yokogawa DL850 ScopeCorder is 5 Sa/sec
- Methods for much lower sample rates
- External clock, etc.
The AC Power Input in all Yokogawa instruments is designed as a 3-pin connection (one of which is a GND pin). In some parts of the world, PCs are sold with AC power cables that are 2-pin. Often times this means the ...
We do not have an instruction manual describing the *.WDF file format structure like we did for the *.WVF files.
We provide a list of support options with more details.
High Resolution mode can be used to remove high frequency noise and increase vertical resolution. It achieves this by increasing the number of effective bits per data to 12-bits through digital and bandwidth filters.
- Unbalanced input, balanced input, isolated input, and differential input
- Types of inputs guide presentation
- Related products and solutions
The measured propagation delay for the PB500 500 MHz Passive Probe (701943) is approximately 8.2 ns. A simple way of measuring the propagation delay, using the DL9000, is to measure the delay between two ...
Even though the display record length is shorter than the specified record length, measurement is made over the full record length. There is no function that allows you to move the display position to view the other ...
The Time Axis Accuracy is the accuracy of the A/D clock. It is not possible to directly measure the A/D clock and the A/D clock is not output from the ScopeCorder DL850/SL1400. To verify the accuracy of the A/D clock, you will ...
Question:If the DL9000 Oscilloscopes is in normal trigger mode and no waveform acquisitions have been made i.e. the scope has not triggered, a query to the instrument using the :Waveform:Record or :History:Record? Minimum it returns ...
Yes, the NAK CAN Bus Trigger is supported on the DLM2000 Mixed Signal Oscilloscope and DL9000 Digital Oscilloscope. DL9000: Refer to the IM 701310-51E (page 3-13)DLM2000: Refer to the IM 710105-02E (page 2-16)
Although the DLM2000/DL9000 Mixed Signal Oscilloscope does not have a BoxAvg acquisition mode, there is an alternative method for achieving the same effect. The combination of Hi-Res mode and a low pass bandwidth filter will work in the same ...
If your DL series oscilloscope is not measuring rise or fall time, it may be because you are attempting to measure asymmetric waveforms. It is not possible to perform automatic rise or fall time measurements on DL ...
In general, the recommended sampling rate for CAN bus or I2C analysis is 10x the bit-rate. If the waveform is not noisy, the sampling rate can be set to around 4-5x the bit-rate.
Unfortunately we do not have an automated program for adjusting the DL9000 digital oscilloscope is it is failing calibration. Please follow the procedures on the DL9000 service manual or the CE handbook.
The Header Size entry, for a ASCII format data file, denotes the number of header lines in the header part of the ASCII File.
- The Offset function vs. the Position function
- Set vertical position of a waveform in voltage value (v)
- Set horizontal location of a waveform in division value (div)
You can express any arbitrary exponentiation, in Xviewer or DL series instruments, by using the LOG (common logarithm) and EXP (exponential) functions. For example, for C1 raised to the exponent of 0.2, the math ...
- DC Precision when changing the DC waveform position setting on DL1600
- How to calculate DC offset voltage
- Xviewer can open multiple files from different DL, SL, and WE series instruments into a single window display
- Same sample rate, trigger position, record length
There are three kinds of standards for which a differential probe is necessary: FlexRay CAN UART (Some but not all UART) It is not necessary to use a differential probe for the LIN, I2C and SPI standards.
- "Beat Method" for Inspecting an Oscilloscope’s Time Base Accuracy
- Inspect and verify time base accuracy
- Aliasing effect to create a "beat waveform."
- Time base setting formula
No, the DL9000 cannot be upgraded or modified to a SB5000.
If you selected Decimation or P-P Compression when saving waveform data in ASCII CSV format, then the HResolution will not be equivalent to the Sampling Rate. If Decimation or P-P Compression is not selected, then ...
The true noise floor of a Yokogawa oscilloscope is ≤ 2-3mVpp. The DL9000 Digital Oscilloscope, for example, has approximately 280uV residual noise at 2mV/Div with input termination set to 50Ω. The residual noise may be measured by ...
The IEC Harmonic analysis on the DL/DLM series oscilloscopes provides a rough analysis and estimation for harmonic testing. The scope will perform an FFT on the current waveform and can be used to measure the general ...
Instruction Manuals
- DL9000 Series Serial Bus Signal Analysis Function (The analysis features of I2C, CAN, LIN, SPI , and UART signals) (3.1 MB)
- Regarding the DL9000 Series Digital Oscilloscope Communication Interface User's Manual CD-ROM (117 KB)
- USB Compliance Test Fixture (418 KB)
- DL9040/DL9140/DL9240 SeriesDigital Oscilloscope Communication Interface USER'S MANUAL (4.1 MB)
- DL9040/DL9140/DL9240 Series Digital Oscilloscope Communication Interface≪Notice of Alterations≫ (110 KB)
- DL9040/DL9140/DL9240 Series Digital Oscilloscope USER'S MANUAL (13.4 MB)
- DL9040/DL9140/DL9240 Series Digital Oscilloscope≪Notice of Alterations≫ (115 KB)
- RACK MOUNTING KIT For an EIA-compliant Single-housing Rack (1.2 MB)
- RACK MOUNTING KIT For a JIS-compliant Single-housing Rack (3.8 MB)
- USB Compliance Test Software (2.7 MB)
- Universal Serial Bus 2.0 Device Compliance Test Procedure (4.8 MB)
- Universal Serial Bus 2.0 Host Compliance Test Procedure (3.6 MB)
- Universal Serial Bus 2.0 Hub Compliance Test Procedure (8.5 MB)
- DL9000 Series Digital Oscilloscopes/SB5000 Series Vehicle Serial Bus Analyzer Power Supply Analysis Function (772 KB)
- Sample Program for the DL9000/SB5000/DL6000/DLM6000 Series Digital Oscilloscope Read this first. (171 KB)
- DL9000/DL6000/DLM6000/SB5000 USB Driver Installation Manual (710 KB)
- DL9040/DL9140/DL9240 Series Digital Oscilloscope OPERATION GUIDE (2.5 MB)
Software
- Xviewer 701992 / XviewerLITE
- Xwirepuller
- Symbol Editor
- Mask Pattern Editor
- Binary Data File Converter
- Communication Sample Programs
- USB Drivers
- TMCTL
- Yokogawa WDF DataPlugin ( NATIONAL INSTRUMENTS Web Page )
- LabVIEW Drivers for DL9000, SB5000, DL6000/DLM6000 Series ( NATIONAL INSTRUMENTS Web Page )