Long Wavelength Optical Spectrum Analyzer AQ6375 (DISCONTINUED)

High Performance LONG WAVELENGTH
The AQ6375 is the first bench-top optical spectrum analyzer covering the long wavelengths over 2 μm.
It is designed for researchers and engineers who have been struggling with inadequate test equipment to measure in these long wavelength ranges. The AQ6375 achieves high speed measurements with high accuracy, resolution and sensitivity, even while providing full analysis features. Troublesome calibration steps and the development of external analysis software is no longer required.
The features of AQ6375 are indispensable
- to the research, development and manufaturing of optical devices in the wavelength range from telecom band to 2.4µm
- to perform gas measurements in the environment
- to perform non invasive analyses in Life Science applications
WORLD CLASS PERFORMANCE and SETTING FLEXIBILITY
- Long wavelengths measurement range
- High sensitivity
- High resolution & wide dynamic range
- High speed measurement
- Fast auto-calibration
- Free space optical input
Long Wavelength Range: from 1200nm to 2400nm
The AQ6375 covers not only the wavelength span used in communications, but also the 2µm region which is used for environmental sensing, medical, biology and industrial applications.
High Sensitivity: down to -70dBm
The AQ6375 can measure optical power from +20dBm down to -70dBm thanks to its high-dynamic and very low noise components and circuits used for photodetection. This enables precise measurements of both high power and low power sources.
Measurement sensitivity can be chosen among 7 values according also to the measurement speed required by the specific test to be performed.

High Resolution & Wide Dynamic Range
The AQ6375 uses a double-pass monochromator structure to achieve high wavelength resolution (0.05 nm) and wide close-in dynamic range (55 dB). Thus, closely allocated signals and noise can be separately measured.

Measured HeNe Laser (1523 nm), Close-in Dynamic range: @ peak±0.8 nm
High speed Measurement
GREATER EFFICIENCY
High Speed Sweep
With a proprietary sweep technique the AQ6375 achieves a much faster sweep speed than conventional measurement systems which use a monochromator. Max. sweep time is only 0.5 sec. for 100 nm span.
Fast command processing and data transfer
Applying a fast microprocessor, the AQ6375 achieves very fast command processing speed and Ethernet interface provides up to 100 times faster data transfer speed than GP-IB.
Fast auto-calibration
The calibration and alignment process takes less than 2 minutes and it is full automatic.
Free-Space Optical Input
The AQ6375 uses a free-space optical input structure, i.e. no fiber is mounted inside the instrument.

This smart solution is
- WORRY-FREE, as no internal fiber can be scratched or get dirty
- MAINTENANCE-FREE, as no internal fiber has to be cleaned
- VERSATILE, as the instrument accepts both /PC and /APC connectors
- DUAL PURPOSE, as the instrument accepts both Single-Mode and Multi-Mode fibers without being affected by the high insertion loss from MM-SM fibers matching
AQ6375 has been designed to increase productivity of R&D and Production personnel.
It software has pre-installed analysis functions for the most common optoelectronic (passive and active) devices. The automatic calculation of the major parameters of the device under test will contribute to its fast characterisation.
Moreover AQ6375 has the possibility to be programmed to perform automatic measurements while controlling other lab equipment.
Built-in analysis functions to increase your testing efficiency
- THRESH method
- ENVELOPE method
- RMS method
- PEAK RMS method
It is possible to measure the polarization mode dispersion (PMD) of a DUT (such as an optical fiber) by using the instrument in combination with an analyzer, polarization controller, polarizer, and an amplified spontaneous emission (ASE) light source, high-output LED light source, or other wideband light source.
WDM Analysis
With this function it is easy to analyze WDM transmission signals. You can also measure OSNR of a DWDM transmission system with 50 GHz spacing. Measurements of WDM signal wavelength, level, wavelength interval, and OSNR can be made collectively on up to 1024 channels, and the analysis results can be displayed in a data table.
Optical Amp Analysis
Measurement can be performed of the optical amplifier gain and noise figure from measured waveform of the signal light going into the optical amp, as well as the measured waveform of the output light leaving the optical amp.
Optical Filter Characteristics Measurement
Optical filter characteristics can be measured from the measured waveform of the light input to the optical filter from the light source, as well as from the measured waveform light output from the optical filter.
Analysis can be performed not only on optical filters with only one mode, but also multimode WDM filters.
Measurement of Level Fluctuations in Single-Wavelength Light
This function is used to measure changes over time in the level of a specific wavelength level. The sweep width is set to 0 nm, and measurement of the single-wavelength light is taken. The horizontal axis is the time axes. It is useful for purposes such as optical axis alignment when a light source is input to an optical fiber.
Template Analysis
The template function compares preset reference data (template data) with a measured waveform. In addition, if a function for displaying the target spectrum (target line) on the measurement screen is used, the target spectrum can be referenced while adjusting the optical axis of an optical device.
Go/No Go Judgment
The Go/No Go test function compares the active trace waveform against reference data (template data) preset by the user, and performs a test on the measured waveform (Go/No Go test).
This function can be used effectively in situations such as pass/fail tests on production lines.
Analysis between Line Markers / in the Zoom Area
The instruments perform the analysis of the signal contained into boundaries selected by means of line markers or zoomed area.
Building Automated Test Systems
REMOTE OPERATION
The AQ6375 is equipped with GP-IB, RS-232, and Ethernet (10/100Base-T) interfaces to be connected with an external PC for remote access and building an automated test system. Macro Programming is a useful built-in function to implement a simple auto test program.
COMPATIBLE WITH SCPI
The standard remote commands of the AQ6375 are compatible with SCPI, which is an ASCII text based standard code and format that conforms to IEEE- 488.2.
| AQ6317 EMULATION MODE The AQ6375 supports proprietary remote programming codes of Yokogawa's best selling AQ6317 series for users to easily upgrade from their current automated test environment. MACRO PROGRAMMING Macro programming enables user to easily create test procedures by recording the user's actual key strokes and parameter selections. An external PC is not required because the macro program can also control external equipment through the remote interfaces. |
 |
LabVIEW® DRIVER available

AQ6375 Viewer - Emulation and Remote Control Software (Optional)
AQ6375Viewer is PC application software designed to work with Yokogawa's AQ6375 Optical Spectrum Analyzer.
| EMULATION The software has exactly the same user interface and functions as the AQ6375 so that you can easily display and analyze waveform data. REMOTE CONTROL Note. the data update speed varies depending on network performance and conditions. |
 |
The AQ6375 is the right instrument to test & characterize
- passive optical components like FBGs, Filters, specialty fibers (e.g. Thulium doped)
- active optoelectronics devices like semiconductor LASERs and Supercontinuum light sources used in industrial, telecom and medical/biomedical applications and environmental analysis.
Moreover, its peculiar characteristics and high-level performance make the AQ6375 the ideal OSA to measure gas concentration in the air using Laser Absorption Spectroscopy.
Passive and active devices characterization
Characterization of Fiber Bragg Gratings (FBGs)
A fiber Bragg grating (FBG) is a type of distributed Bragg reflector constructed in a short segment of optical fiber that reflects particular wavelengths of light and transmits all others. This is achieved by creating a periodic variation in the refractive index of the fiber core, which generates a wavelength specific dielectric mirror. A fiber Bragg grating can therefore be used as an inline optical filter to block certain wavelengths, or as a wavelength-specific reflector.
The primary application of fiber Bragg gratings is in optical communications systems. They are specifically used as notch filters. They are also used in optical multiplexers and demultiplexers with an optical circulator, or optical add-drop multiplexer (OADM).
Fiber Bragg gratings can then be used also as direct sensing elements for strain and temperature, in fact the Bragg wavelength of the FBG can be tuned by strain and temperature change applied by a piezoelectric transducer. Specifically, fiber Bragg gratings are finding uses in instrumentation applications such as seismology, pressure sensors for extremely harsh environments, and as downhole sensors in oil and gas wells for measurement of the effects of external pressure, temperature, seismic vibrations and inline flow measurement.
Fiber Bragg gratings are created by "inscribing" or "writing" systematic (periodic or aperiodic) variation of refractive index into the core of a special type of optical fiber using an intense ultraviolet (UV) sources such as KrF or ArF excimer lasers.
However, the functional wavelength of FBG is not the writing wavelength, and for non-communication applications mentioned above (strain and temperature sensors) FBGs tuned on 2-3µm region are used. For testing such FBGs, the AQ6375 is the perfect instrument.
Characterization of Supercontinuum Light Sources
Supercontinuum light is generated by promoting highly nonlinear optical processes in special materials, e.g. photonic crystal fiber, by pumping them with a mode-locked pulsed laser (typically a femtosecond Ti:Sapphire laser).
Supercontinuum light can be best described as ‘broad as a lamp, bright as a laser', in fact it matches the characteristics of incandescent and fluorescent lamps - i.e. very broad spectrum - with the characteristics of lasers - i.e. high spatial coherence and very high brightness, which enables optimum coupling to a fibre and outstanding single-mode beam quality.
The Supercontinuum light sources are nowadays finding applications in a diverse range of fields, including optical coherence tomography, frequency metrology, fluorescence lifetime imaging, optical communications, gas sensing and many others.
Detecting the multi-wavelenght optical pulses generated by a supercontinuum light sourcewith AQ6375.
AQ6375, thanks to its premium performance, is the right instrument to tests and characterize Supercontinuum light sources during their production and after-production quality check processes.
Characterization of Lasers used in Medical applications
Specific LASERs emitting around 2µm are used nowadays as tools for endoscopic surgery, like Thulium laser used for surgical treatment of prostate cancer.
AQ6375 is the best instrument to test and characterize such kind of LASERs during their production and after-production quality check processes.
Characterization of semiconductor LASERs used in Laser Absorption Spectroscopy
Laser Absorption Spectroscopy is a measurement technique used to detect and measure the gases concentration in the air, in open or closed environment.
As shown in figure 1 below, the Laser Absorption Spectroscopy uses a laser that oscillates in a single vertical mode and can measure concentration of a gas molecule by slightly modulating the oscillation wavelenght of the laser around the absorption wavelenght specific to the gas to be detected and by detecting a change in light spectrum due to molecule absorption.
The lasers used in Absorption Spectroscopy require excellent single-mode operation performance, which directly determines the limits of detection. Furthermore such lasers should produce a stable oscillation in the absorption region in order to achieve sensitive detection of the gas of interest. Most of the greenhouse gases, for example CO2, SO2 , NOX and CH4, has strong absorption lines in the 2µm wavelenght region.
Figure 2 shows the result of measurement of the spectrum of a DFB-LD that oscillates in the near-infrared region of 2µm with the single vertical mode.

Gas detection and concentration measurements by Laser Absorption Spectroscopy
Hydrogen Cyanide H13C14N absorption spectrum measurement ‐ AQ6375 synchronous sweep with tunable laser source.
The global warming gases, called greenhouse gases, like CO2, SO2, NOX and CH4, has strong absorption lines in the 2µm wavelenght region. The presence anc concentration of those gases in the atmosphere can be determined by measuring the optical absorption spectrum of the gas mixture under test.
Thanks to its Free Space Optical Input, the AQ6375 can also measure the absorption spectrum of an air column using the Sun as light source and transferring by a MultiMode fiber the light passed-through the mixture.
Figure 4: Absorption lines of some gases in SW-IR and MW-IR (IR-B DIN) region
Figure 5: measurement setup to detect a specific gas in the air, e.g. Methane (CH4):
Cavity Ring-Down Spectroscopy applications (CRDS)
CRDS is a highly sensitive optical spectroscopic technique that enables measurement of absolute optical extinction by samples that scatter and absorb light. It has been widely used to study gaseous samples which absorb light at specific wavelengths, and in turn to determine mole fractions down to the parts per trillion level. The technique is also known as cavity ring-down laser absorption spectroscopy (CRLAS).
A typical CRDS setup consists of a laser that is used to illuminate a high-finesse optical cavity, which in its simplest form consists of two highly reflective mirrors. When the laser is in resonance with a cavity mode, intensity builds up in the cavity due to constructive interference. The laser is then turned off in order to allow the measurement of the exponentially decaying light intensity leaking from the cavity. During this decay, light is reflected back and forth thousands of times between the mirrors giving an effective path length for the extinction on the order of a few kilometers.
If something that absorbs light is placed in the cavity, the amount of light decreases faster-it makes fewer bounces before it is all gone. A CRDS setup measures how long it takes for the light to decay to 1/e of its initial intensity, and this "ringdown time" can be used to calculate the concentration of the absorbing substance in the gas mixture in the cavity.
Cavity ring down spectroscopy is a form of laser absorption spectroscopy. In CRDS, a laser pulse is trapped in a highly reflective (typically R > 99.9%) detection cavity. The intensity of the trapped pulse will decrease by a fixed percentage during each round trip within the cell due to both absorption and scattering by the medium within the cell and reflectivity losses.
One of the major applications of CRDS is breath analysis:
The following graph shows the spectra of the biomarker hydrogen cyanide (HCN) along with water vapor (H2O) at atmospheric pressure and at concentrations typically found in exhaled human breath:
The AQ6375 has the right charatceristics to be an effective instrument to measure the output of CRDS systems.
Bio-analysis
Photonics is nowadays more and more applied in medical diagnostic. For example let's consider blood analysis.
Many components of blood have absorption wavelength in the VIS and NIR region:
Neutral fat: 656, 724, 756, 796, 882, 1040, 1972, 2270, 2354, 2444nm
Phosphorus: 514, 576, 770, 1132, 1178, 1234, 1250, 1992, 2008, 2384nm
Potassium: 428, 690, 1228, 1380, 1382, 1952, 2260, 2340, 2396, 2416nm
Lactic acid: 412, 506, 516, 646, 1918, 1976, 1990, 2040, 2378nm
Albumin: 604, 1726, 1858, 2192, 2194, 2218, 2220, 2222, 2224, 2248nm
Glucose: 1500 - 1800nm
Yokogawa AQ6375 and AQ6373 cover the whole range of absorption wavelengths of these substances and can detect therefore their presence and concentration by means of Laser Absorption Spectroscopy.
A complete suite of connection interfaces
The AQ6375 is equipped with several electrical interfaces (GP-IB, RS-232, PS-2, USB, RJ-45 Ethernet, SVGA video output, analog (voltage) output, trigger input & output) which allow the user to easily operate on it in the lab as well as from remote.
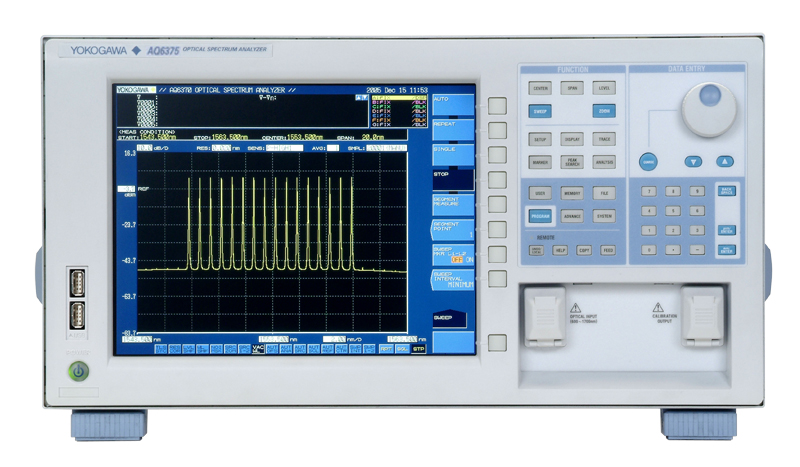
Front View
The AQ6370 adopts a universal type optical connector system for optical input and calibration output enabling direct coupling to major optical connectors (FC, SC or ST). The connectors can be replaced by users.

2 ports are available on the front panel, supporting keyboard, mouse, memory stick and external HDD.

Note: USB ports can't be used for instrument's remote control. For this purpose the instrument has an Ethernet RJ45 port on its back panel.
Rear View


NA Conversion Adapter
- 735383-A001, A002 numerical aperture conversion adapters
- Half numerical aperture of optical fiber
- AQ6370 series optical spectrum analyzers' free-space optical input structure


To accurately measure pulsed light using an optical spectrum analyzer (OSA), it is necessary to understand the characteristics of the OSA and select the appropriate measurement method and settings.


The AQ6370C Optical Spectrum Analyzer was developed in accordance with the IEC standard: WG4 (IEC 61280-1-3) Test procedures for general communication subsystems -Central wavelength and spectral width measurement. We cannot guarantee the RMS ...
The remote viewer may not start if the screen resolution is too low. Adjust the screen resolution to 1024 by 768 pixels (or larger) then restart the software.
If you have products currently in China that require calibration or repair, you may either return them to your local Yokogawa service center or the Yokogawa China Service & Repair Center. Please be advised that ...
Level Accuracy:Level Accuracy is a tolerance to the true value of measured value, when a standard level is measured with a standard wavelength. Level Linearity:Level Linearity is the width of error dispersion ...

Wavelength accuracy: Wavelength accuracy is a tolerance to the true value of a measured value when the standard wavelength is measured. Wavelength repeatability:Wavelength repeatability is the stability of ...
Yes, the AQ6370 Optical Spectrum Analyzer Viewer Software is compatible with Windows 7 32-bit and 64-bit. Note: Please make sure the correct USB driver is installed for either Windows 7 32-bit or 64-bit.
If the AQ637X series Optical Spectrum Analyzer is already running and you attempt to connect an external display, the OSA will not automatically detect the external display. The OSA will need to be re-booted before it can recognize and ...
- AQ637X Optical Spectrum Analyzer sanitation procedure
- Restore settings to defaults with parameter initialization
The Chopped Light mode is used: To increase measurement level sensitivity by cutting the high frequency noise To detect only the light that the LS emitted, effective for free space measurement. In free space ...
If you are performing wavelength calibration using the instrument's built-in light source, the warning message is an indication that the monochromator needs to be repaired. Please visit our Contact site to locate ...
- It is possible to convert an AQ6370 Optical Spectrum Analyzer Binary file to ASCII .CSV file using the AQ6370 Viewer Software?
- Different AQ637X series OSA Viewer software will load specific binary file extensions.
For the AQ6373 Optical Spectrum Analyzer you can use a maximum 800 micron core fiber that must be terminated in a standard FC connector. For the AQ6375 and AQ6370 series OSA you can use a maximum 200 micron core fiber which, ...
The AQ637X Optical Spectrum Analyzer has a feature called Auto Offset that it performs every 10 minutes. What this feature does is zero out the OP amps in the OSA to ensure constant level accuracy. This feature will however, stop the OSA ...
The resolution is controlled by 3 factors: Input Slit Detraction Grating Output Slit The resolution setting controls the output slit disk. This disk has a fixed number of slits in it. Since the setting only control ...
No, unfortunately due to the number of current fiber combinations, we do not stock optical fibers. There are many companies that specialize in optical fiber cords.
Please clean the fiber used between the calibration output and the optical input.
Instruction Manuals
- AQ6375 Optical Spectrum Analyzer User's Manual (21.0 MB)
- AQ6375 Optical Apectrum Analyzer User's Manual (20.5 MB)
- AQ6375 Optical Apectrum Analyzer User's Manual ≪Notice of Alterations≫ (86 KB)
- AQ6370B/AQ6373/AQ6375 Optical Spectrum Analyzer Remote Control User's Manual (3.0 MB)
- AQ6375 Optical Spectrum Analyzer Getting Start Guide (1.6 MB)
- AQ6370C/AQ6370D/AQ6373/AQ6373B/AQ6375/AQ6375B Optical Spectrum Analyzer Remote Control User's Manual (2.5 MB)
Software
- AQ6370 Viewer
- LabVIEW Drivers for AQ6370 series Optical Spectrum Analyzer ( NATIONAL INSTRUMENTS Web Page )
- MATLAB Toolkit for AQ6370 series Optical Spectrum Analyzer
Firmware
Product Overviews

The AQ6375 is the first bench-top optical spectrum analyzer covering the long wavelengths over 2 ?m.
It is designed for researchers and engineers who have been struggling with inadequate test equipment to measure in these long wavelength ranges. The AQ6375 achieves high speed measurements with high accuracy, resolution and sensitivity, even while providing full analysis features. Troublesome calibration steps and the development of external analysis software is no longer required.

