Harmonic and Flicker Testing Software
The measurement procedures and settings for harmonic/flicker standards testing have been precisely defined. Engineers must also stay current with the specialized knowledge and up-to-date information required to periodically review the contents of the standards and perform the standards conformance tests. Yokogawa's Harmonic/Flicker Measurement Software enables engineers to perform a range of operations using the WT5000 and the WT3000/WT3000E Precision Power Analyzer, including judging standards compliance and outputting test reports. Supported standards include:
WT3000 Harmonics: EN61000-3-2 / IEC61000-3-2, EN61000-3-12 / IEC61000-3-12, and JIS C 61000-3-2
WT3000 Flicker: EN61000-3-3 / IEC61000-3-3, EN61000-3-11 / IEC61000-3-11
WT5000 Harmonics: EN61000-3-2 / IEC61000-3-2, EN61000-3-12 / IEC61000-3-12, EN61000-4-7 / IEC61000-4-7, JIS C61000-3-2, and JIS C61000-4-7
WT5000 Flicker: EN61000-3-3 / IEC61000-3-3, EN61000-3-11 / IEC61000-3-11, and EN61000-4-15 / IEC61000-4-15

Main Software Functions
Three Measurement Modes (during online operation)
- Harmonic Measurement Mode
Can evaluate measurement data while harmonics are being measured by a WT3000/WT3000E.
NOTE: Saved measurement data can also be read and displayed during offline operation. - Harmonics Observation Mode
Lets you observe harmonic variations as bar graphs or lists of numerical values, while harmonics are being measured by a WT Series digital power meter. Use this mode to observe changes in harmonic data. - Waveform Observation Mode Lets you observe measured waveforms. Use this mode to observe waveform states.
Evaluations by Class
Can evaluate * data by class (A, B, C or D). Can evaluate whether the current value is within the maximum permitted harmonic current limit value (or within the power ratio limit value).
Harmonic Current Continuous Measurement
Lets you measure the harmonic current over a set amount of time. Can evaluate whether the result is within the limit value.*
Repeatability of Measurement Data
Maximum values and average values in harmonic measurement data can be compared and measurement data differences can be displayed as bar graphs and numerical values for each harmonic order saved. This mode lets you evaluate* whether values are within the 5% range specified by the standard (repeatability).
*Evaluations conforming to the IEC61000-3-2 Ed. 4.0 are only supported by WT3000/WT3000E.
Support for Tests Complying with IEC61000-3-2 Ed4.0
Harmonic measurement system configuration
*3: Many AC Power Sources are available to provide the low-distortion AC Voltage and frequency to power the device under test. In addition, for fullcompliance testing, the power source must be capable of supplying the full 16 A load current specified by the IEC standard. Contact your local Yokogawa representative for recommendations.*4: The model that full supports the standard is the WT3000/WT3000E.
Compliance with Standard of WT3000/WT3000E Digital Power Analyzer
In the EN61000-3-2:2006 Am2: 2009 (IEC61000-3-2 Ed 3.0 Am2 or EN61000-3-2:2014) , requirements for measuring devices are set forth by IEC61000-4-7 Ed 2.0 Am1. The table below shows the items the WT3000/WT3000E digital power analyzer complies with among the EN61000-3-2: 2006 Am2: 2009 (IEC61000-3-2 Ed 3.0 Am2 or EN61000-3-2:2014) related items in IEC61000-4-7 Ed 2.0 Am1.
| Item | IEC61000-4-7 Ed 2.0 Am1 | Pricision Power Analyzer WT3000/WT3000E |
Compliance with Standard |
| Current measurement error |
5% of maximum allowance value or 0.15% of rated current, whichever is larger. |
Accuracy for 40th-order frequency of 2.4 kHz with 60 Hz fundamental frequency (direct inpuit): crest factor 3 (2.5% of reading+0.05% of range) within 5% error (when 2% or larger of input />range)crest factor 6 (2.5% of reading+0.1% of range) within 5% error (when 4% or larger of input range) |
Yes |
| Measuring instrument loss in current input circuit |
Voltage drop: 0.15V max. |
Measuring instrument loss: 5.5Ω approx. + 0.03 µH approx. |
Complies through 27 Arms approx. |
| Crest factor in current input circuit |
5Arms or less: 4 10Arms or less: 3.5 10Arms or over: 2.5 Overload display required |
3 or 6 Has overload display |
Yes |
| Range Composition of current input circuit; excenssive input resistance |
Direct input ranges: 0.1, 0.2, 0.5, 1, 2, 5, 10, 20, 50, 100A are appropriate ranges. |
0.5, 1, 2, 5, 10, 20, 30 A ranges (for crest factor 3) 0.25, 0.5, 1, 2, 5, 10, 15A range (for crest factor 6) |
Complies within ranges on left. Precise measurements require attention to the range selection and the crest |
| Range for external shunt: 0.1 to 1 V is appropriate. | 0.5, 1, 2, 5, 10, 20, 30 A ranges (for crest factor 3) 0.25, 0.5, 1, 2, 5, 10, 15A range (for crest factor 6) |
||
| Maximum input is 1.2 times the range (cintinuous), or 10 times the range (1 second). | Direct input: peak current of 90 A or RMS of 33 A, whichever is lower (continuous). peak current of 150 A or RMS of 50 A, whichever is lower (1 second). External sensor input: Peak value not to exceed 5 times the range (continous) Peak value not to exceed 10 times the range (1 second) |
||
| Anti-aliasing | -50 dB min. | -50 dB min. for fundamental frequency of 50 / 60 Hz up to 40th-order harmonic | Yes |
| Window function shape | Rectangular | Rectangular | Yes |
| Window function width | 10 cycle (50Hz)/12 cycle (60Hz) | 10 cycle (50Hz)/12 cycle (60Hz) | Yes |
| Relative deviation of sampling frequency and fundamental frequency |
Within ±0.03% | Within ±0.03% | Yes |
| Smoothing | Time constant: 1.5 seconds | Time constant: 1.5 seconds | Yes |
| Filter time constant of Smoothing (Window width: 200ms ) |  |
|
Yes |
| General specifications | Effects of temperature, humidity, power voltage, common mode voltage, static electricity, and radiation field are specified. |
See general specifications items. |
Complies for general specifications. |
For Harmonics and Flicker specification on the WT5000, click here
Firmware version 4.01 or later with the following functions.
- Flicker measurement function (/FL option)
- GP-IB interface (standard) or Ethernet interface (/C7 option)
Functions
| Measurement modes | Harmonic measurement, harmonic observation, waveform observation |
| File types | Settings information files, measurement data files, screen image files, report files |
| Data conversion | Harmonic and waveform data can be converted to CSV format. |
| Display screens | Measurement value judgement graphs, harmonic current bar graphs, harmonic current measurement value lists, harmonic current variation graphs, waveform graphs, voltage/current/power variation graphs, harmonic voltage bar graphs, harmonic voltage measurement value lists, harmonic phase angle bar graphs, harmonic phase angle measurement value lists |
| Data acquisition time | Can be set to any value between 1 second and 24 hours, 00 minutes, 00 seconds, in 1-second step |
| Communications | GP-IB interface (WT3000/WT3000E) Ethernet (WT3000/WT3000E) |
System Requirements
PC
Operating System
English version of Windows Vista, Windows 7, Windows 8, Windows 8.1 or Windows 10
CPU
Dual core or more processor
Memory
2 GB or more recommended
Hard disk
10GB free space or more
Communication Card
| GP-IB | NI (National Instruments)
 |
| Ethernet | An Ethernet port that supports 10BASE-T, 100BASE-TX, or 1000BASE-T |
| Display, Disk Drive, Printer, and Mouse |
Display Resolution: 1366×768 dots or higher Disk Drive: A drive that can read CD-Rs |
| Operating System | Operating system mentioned above |
The measurement procedures and settings for harmonic/flicker standards testing have been precisely defined. Engineers must also stay current with the specialized knowledge and up-to-date information required to periodically review the contents of the standards and perform the standards conformance tests. The Harmonic/Flicker Measurement Software enables engineers without specialized knowledge to perform a range of operations using the WT3000/WT3000E Precision Power Analyzer including judging standards compliance and outputting test reports.
Note:
Need /G6 option with WT3000/WT3000E for harmonic standard testing.
Need /FL option with WT3000/WT3000E for flicker standard testing.
Need /FQ and /FL options with WT3000/WT3000E for 3-phase flicker standard testing.
Need /G7 option with WT5000 for harmonic and flicker standard testing.
Supported Standards
WT3000 Harmonics: EN61000-3-2 / IEC61000-3-2, EN61000-3-12 / IEC61000-3-12, and JIS C 61000-3-2
WT3000 Flicker: EN61000-3-3 / IEC61000-3-3, EN61000-3-11 / IEC61000-3-11
WT5000 Harmonics: EN61000-3-2 / IEC61000-3-2, EN61000-3-12 / IEC61000-3-12, EN61000-4-7 / IEC61000-4-7, JIS C61000-3-2, and JIS C61000-4-7
WT5000 Flicker: EN61000-3-3 / IEC61000-3-3, EN61000-3-11 / IEC61000-3-11, and EN61000-4-15 / IEC61000-4-15
Software Enabling Measurement Complying with Harmonics Standard
Harmonic Current Measurement Value List
Displays harmonic measurement data as a single list.

Viewing Trends
You can capture various types of data measured into your PC at 200ms fixed intervals. Thus, you can view trends graphically. This feature lets you monitor power supply voltage fluctuations, changes in current consumption and other time-based variations.

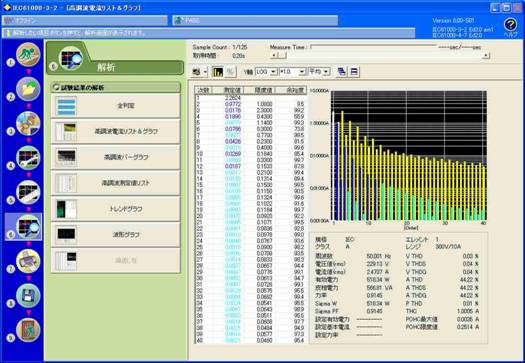
Harmonic Current Measurement Value List
Displays harmonic measurement data as a single list.

Harmonic Current Bar Graph
Evaluates whether harmonic data is within the standard limit value, and displays the result as a bar graph. The display of evaluation results is color-coded, in colors such as red and blue.2

Waveform Observation
Lets you display voltage or current signal waveforms, and measure frequencies and peak values. Moving the cursor lets you display values for the displayed waveform.
2:Evaluations conforming to the IEC61000-3-2 Ed. 4.0

Automatic Report Generation
You can print harmonic measurement results as value lists and graphs, and save image data. Titles and comments can be entered in reports, letting you enter information such as measurement dates/times, device names or control numbers.

Entering Settings on the WT3000/WT3000E/WT5000 from Your PC
You can enter settings on the WT3000/WT3000E/WT5000 from your PC. The wiring method, filters, and scaling settings can be modified.

Converting Data to CSV Format
Waveform data and harmonic current values can be saved on the PC. Measured data can be saved to .csv files for easy access by spreadsheet programs such as EXCEL.

Voltage Fluctuation and Flicker Measurement
Voltage fluctuation and flicker measurement complying with IEC 61000-3-3 is executed. Calculates all the voltage fluctuation and flicker values of dc, dmax, d(t), Pst, and Plt, compares them to the preset limits, and indicates the total judgment.
Measured Value and Judgment for Each Observation Period
Normal Voltage Fluctuation and Flicker Measurement
- The final values of dc, dmax, Tmax, and d(t) are compared with the respective limits, and the judgment (pass or fail) is displayed to the right of the final value. If a steady-state condition does not occur during the measurement period, it is considered to be a fluctuating condition. The measurement result of dc is displayed as Undef (undefined), and the judgment of dc is displayed as Error.
- The short-term flicker value, Pst, is calculated, compared to the limit, and the judgment (pass or fail) is displayed.

Displaying the Trend Graph
You can show Trend Graph View. You can select from the following measurement functions.

| dc | : | Relative steady-state voltage change |
| dmax | : | Maximum relative voltage change |
| Tmax, d(t) | : | Period during which relative voltage change exceeds the threshold level |
| idc | : | Instantaneous relative steady-state voltage change |
| idmax | : | Instantaneous maximum relative voltage change |
| id(t) | : | Period during which instantaneous relative voltage change exceeds the threshold level |
| PF | : | Instantaneous flicker sensation (IFS) |
Displaying the CPF Graph
You can select the element and color to be displayed on the CPF graph.
Up to four elements can be displayed simultaneously.
You can set a separate color for each element.

Printing
You can create reports using the data measured with the software.

WT3000/WT3000E
March 9, 2018
- Updated software version to 6.55
WT5000
March 24, 2020
- New software release version 6.61 S1
Brochures
Instruction Manuals
- Model 761922 Harmonic Analysis Software for the WT3000 (2.0 MB)
- Model 761922 Voltage Fluctuation/Flicker Measurement Software for the WT3000 (1.8 MB)
- Model 761922 Voltage Fluctuation/Flicker Measurement Software (IEC61000-3-11 Compliant) (2.9 MB)
- Model 761922 Harmonic Measurement Software (IEC 61000-3-12 Compliant) (3.5 MB)
- Harmonic Measurement Software (IEC 61000-3-2 Compliant) (4.5 MB)
- Voltage Fluctuation/Flicker Measurement Software (IEC 61000-3-3 Compliant) (2.9 MB)
- Read before Installing the Software (761922 Harmonic/Flicker Measurement Software) (116 KB)
- Model 761922 Harmonic Analysis Software for the WT1600/WT2000 (2.3 MB)