Switching Loss and Surge Analysis of Power Supplies for AI Data Centers

1. Introduction
Generative AI is a type of artificial intelligence that creates new content such as text, images, and audio. This technology leverages deep learning and vast amounts of data to generate new outputs. And as generative AI becomes more widespread, data centers are playing an increasingly vital role.
AI data centers provide high-performance computing resources for training and inference of generative AI models.
In particular, training large-scale generative AI models demands immense computational power. This requires the use of high-performance GPUs and TPUs*, which consume significant amounts of power. AI data centers are also equipped with high-speed networks, large-capacity storage, and advanced cooling technologies, all of which contribute to substantial power consumption.
In this context, improving the energy efficiency of AI data centers requires careful consideration of switching losses in DC-DC conversion. DC-DC converters play a vital role in voltage regulation, especially in applications demanding high-efficiency power conversion, but they inherently incur various types of power losses—among which switching loss is a particularly significant factor affecting overall efficiency.
*GPU: Graphics Processing Unit
2. Challenges
While a device’s overall power consumption is measured using a wattmeter, switching loss is typically measured with an oscilloscope due to the fast rise times of power devices.
Although manually calculating switching loss by placing a cursor on the captured waveform is common, this method is time-consuming and labor-intensive.
High-speed devices, such as SiC and GaN, generate large surges at the rising edge of signals, which can potentially damage the devices and surrounding circuits. Surge monitoring is therefore crucial. Additionally, since converters and inverters use numerous switching devices, multiple measurement points are required when checking their operation.
3. Solutions with Yokogawa’s high-definition oscilloscopes and differential probes
This document introduces an approach that leverages the capabilities of our high-definition oscilloscopes and differential probes to address the challenges mentioned above.
High-definition oscilloscope
• Maximum frequency bandwidth: 500 MHz;
Maximum sample rate: 2.5 GS/s
• Maximum record length: 500M points (all channels);
1G points (odd-numbered channels only)
• Maximum number of inputs:
DLM3000HD: 4 analog channels/3 analog channels + 8-bit logic
DLM5000HD: 8 analog channels + 32-bit
logicDouble the input channels by connecting two units
with the DLMsync function
• ADC resolution: 12-bit
• Switching-loss calculation function, two-location zoom
function, history function, statistical measurement
function, UART/I2C/SPI trigger and analysis functions
Differential Probe
• Frequency bandwidth: 400 MHz
• Maximum differential input voltage (DC + ACpeak):
702921: ±100 V (50:1) / ±1,000 V (500:1)
702922: ±200 V (50:1) / ±2,000 V (500:1)
• Maximum input voltage (ground to ground) (DC + ACpeak):
702921: ±1,000 V
702922: ±2,000 V

3.1 Measurement of switching loss
Switching losses in power devices are typically calculated based on the product of voltage and current in the turn-on/ off section, and power calculations using current and constants such as ON resistance (RDS(on)) and saturation voltage (VCE(sat)) during the conduction phase. However, the switching loss calculation function in the DLM series’ power supply analysis function can easily perform these calculations.

Figure 1. Overview of switching loss
For instance, when measuring a MOSFET, the following losses can be readily calculated as power [W] and electric energy [J or Wh] by entering the voltage, current-level values, isolating the switching section, and specifying the ON resistance value:
• Turn-on loss
• Conduction loss
• Turn-off loss
• Total of the above
The DLM series allows you to zoom in on any two points simultaneously. This enables focused analysis of the turn-on/ off area within the cycle of interest, as shown in Figure 2, where ringing and noise conditions can be observed.

Figure 2. Switching losses are obtained by focusing on a single cycle
Be sure to note that both probes* and oscilloscopes have inherent rise times, which can impact measurements, as shown in Figure 3.
*Active probes only. Passive probes are considered part of the oscilloscope.

Figure 3. Rise time observed on the oscilloscope
If the actual signal rise time is Tr-S, the rise time specific to the probe is Tr-P, and the rise time specific to the oscilloscope is Tr-O, the rise time of the waveform displayed on the oscilloscope Tr−D can be expressed by the following formula.
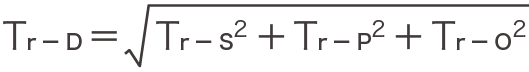
In addition, probe- and oscilloscope-specific rise times can be approximated by the following equation:
Rise time [s] = 0.35/frequency bandwidth [Hz]
Based on these equations, Table 1 shows the theoretical error between the actual signal rise time and the rise time displayed on the oscilloscope when signals with rise times of 20 ns (SiC range) and 5 ns (GaN range) are observed with an oscilloscope with a bandwidth of 500 MHz and differential probes with bandwidths of 150 MHz and 400 MHz. Since the error directly affects the switching-loss calculation, be sure to select the probe and oscilloscope according to the device specifications.
By combining the DLM series 500-MHz model with differential probes 702921/702922, you can measure a signal with a rise time of 5 ns with an error of approximately 2.5%.*
*These values are theoretical and may vary depending on the frequency characteristics of the actual probe or oscilloscope, the measurement environment, and the probing method used.
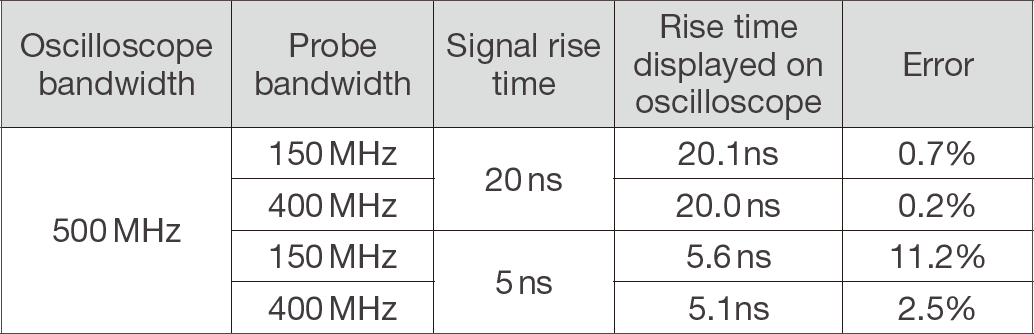
Table 1: Errors in rise time by measurement condition (Theoretical values)
3.2 Measurement of surge ringing
The fast rise times of SiC and GaN devices mean that strong surges and ringing can occur between the drain and source.
These phenomena are caused by the inductance of the device package, the wiring inductance of the peripheral circuit, and the parasitic capacitance of the device. Ensuring that these surges do not exceed the device’s maximum rated voltage is a critical design consideration for converters and inverters.
As such, observing surges has become even more crucial, and the use of a high-definition oscilloscope enables more accurate measurements of these phenomena.
For example, when measuring surges exceeding 1,000 V with a voltage range of 250 V/div on an oscilloscope, the DLM3000/DLM5000, with 8-bit vertical axis resolution, provide a minimum resolution of 10 V. However, with the DLM3000HD/DLM5000HD, the minimum resolution is 1/16th of this, enabling detection of phenomena 1 V or less.

Figure 4. Difference in waveform appearance based on vertical axis resolution
Furthermore, next-generation devices are not only faster than conventional ones but also tend to operate at higher voltages. The combined effect of these factors is expected to result in significantly higher peak surge voltages.
As a result, you need to set the oscilloscope’s voltage range approximately one or two ranges higher than before.
However, if there are concerns about a deterioration in measurement resolution, a high-definition oscilloscope becomes an effective option.
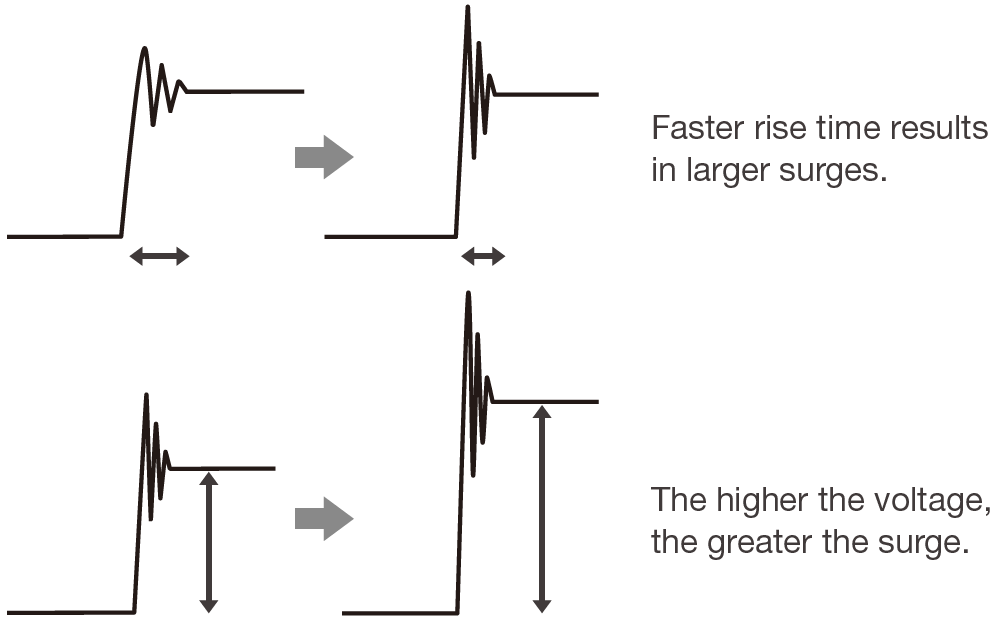
Figure 5. Surge voltage trends in high-speed, high-voltage devices
When measuring maximum surge voltages, a common approach is to set the trigger mode to Normal, adjust the trigger level near the surge peak, and measure the highest value of the captured waveform. However, you can streamline this process by using the DLM series’ history function in combination with the statistical measurement function.
The history function stores previously captured waveforms in memory for later analysis. For example, with a record length of 1.25k points, the DLM3000HD/DLM5000HD can store up to 200,000 waveforms, though this depends on the record length.
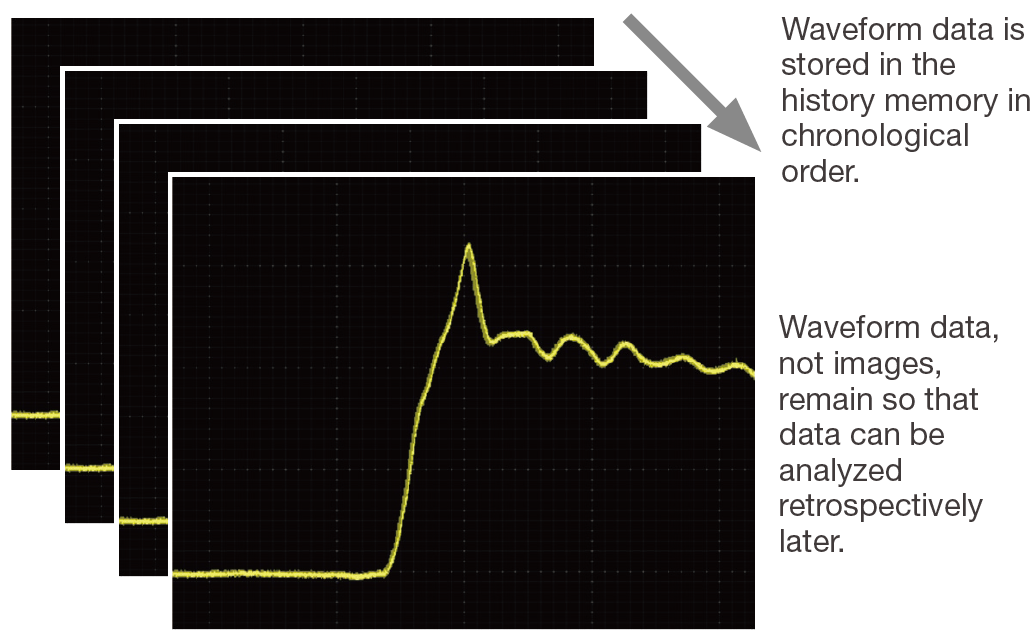
Figure 6. History function
With the DLM series you can set the number of waveform captures in normal mode. If acquisition dead time is a concern, selecting N-Single in the trigger mode reduces dead time to less than 1 μs.
In addition, the historical measurement statistics function enables you to identify the maximum value across all stored waveforms and calculate key statistical metrics such as maximum, minimum, mean, standard deviation, and population size.
3.3 Verifying converter and inverter operation
Verifying the operation of converters and inverters typically requires numerous measurement points. For example, in a three-phase inverter using MOSFETs, as illustrated in Fig. 7, measuring both the gate-source and drain-source voltages for each of the six switching devices results in 12 points.
Adding measurements for three output current paths brings the total to 15 points.
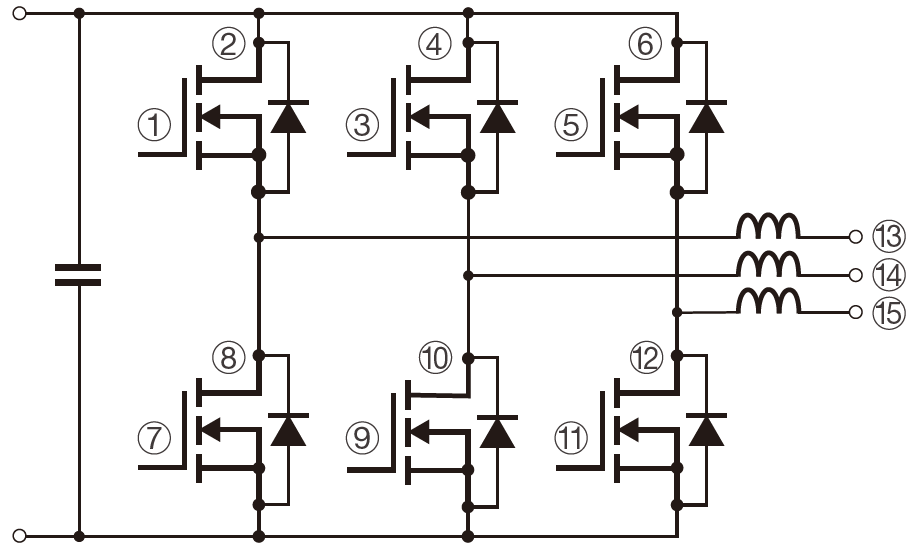
Figure 7. Example of inverter measurement points
Using a standard four-channel oscilloscope, this type of measurement is often split across multiple sessions or carried out by connecting several oscilloscopes and synchronizing them via a shared trigger to increase the number of channels to be measured at the same time.
However, the former measurement approach is timeconsuming and inefficient, while the latter can suffer from trigger skew, especially in high-speed measurements, requiring frequent deskewing between devices.
The DLM5000HD solves these problems with its DLMsync function, which enables synchronous operation of up to 16 analog channels. The DLMsync function is easy to set up— just connect the two units using dedicated synchronization cables and press the button on the menu. Synchronization occurs at the sampling clock level, delivering high accuracy synchronization at just ±50 ps.
The DLM3000HD also supports DLMsync function between two units, so you can operate with four channels for standard tasks and expand to eight channels when needed.
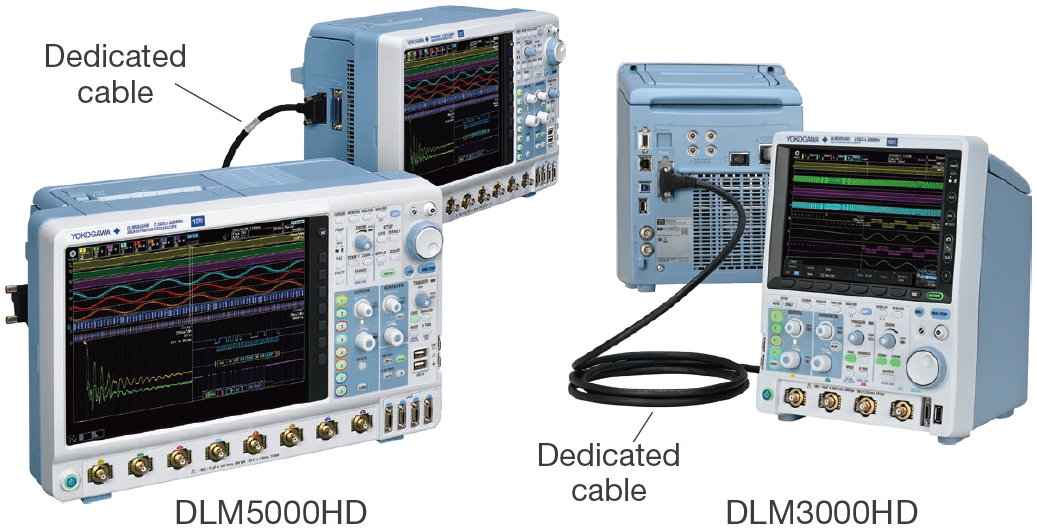
Figure 8. DLMsync function
3.4 Analysis associated with serial bus communication
Communication between microcontrollers and peripheral devices is often handled via serial buses such as UART, I2C, and SPI. The DLM series’ serial bus trigger and analysis functions are especially useful for timing analysis and troubleshooting associated with these interfaces. This feature allows you to trigger on specific data patterns, decode communication content based on waveform data, and display the results directly on screen. Decoded data can also be displayed in a detailed list format or exported as a CSV file. Yokogawa’s unique Serial Bus Auto-Setup function further simplifies the process, automatically configuring necessary settings with a single touch, even if the exact communication specifications (such as baud rate) are unknown.
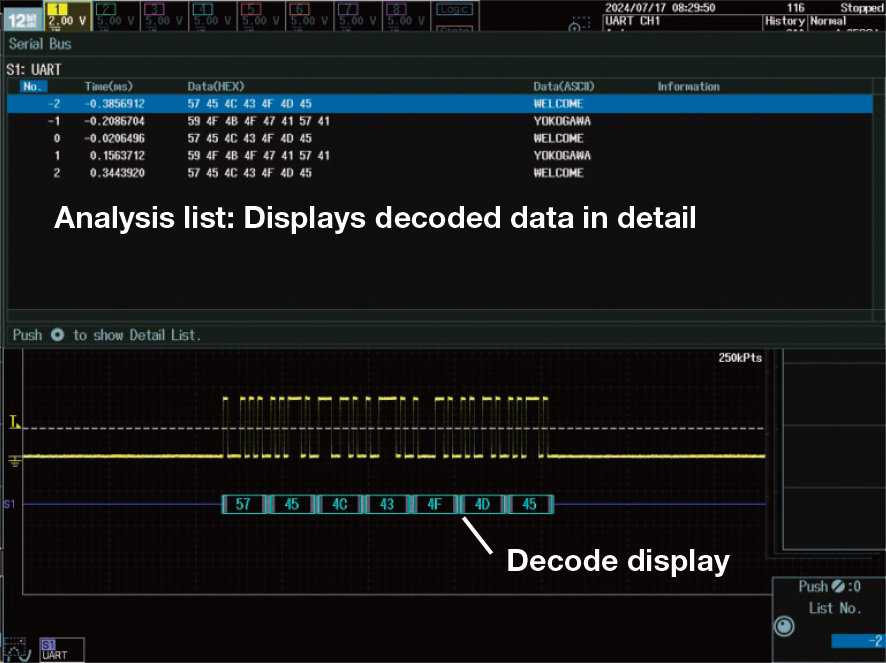
Figure 9. UART trigger and analysis function
Related Industries
Related Products & Solutions

702922 PBDH0400 Differential Probe 2000 V / 400 MHz
- Wide-bandwidth high-voltage differential probe
- 400 MHz bandwidth
- Max. differential voltage: ±2000V (DC + ACpeak) at 1000:1
- Probe power: Dedicated probe interface for DLM3000, DLM3000HD, DLM5000, DLM5000HD

DLM3000HD Series High-Definition Oscilloscope
The DLM3000HD redefines high-definition in a compact design.
- 4 analog channels
- 8-bit logic
- Bandwidth: 350 or 500 MHz
- Sample Rate: up to 2.5 GS/s
- Vertical resolution: 12-bit
- High resolution mode: up to 16-bit
- Measurement memory: up to 1 GigaPoints
- History waveforms: up to 200,000 triggers
- Synchronization function for up to 8 analog channels
- Logic and Serial Bus Analysis

DLM5000HD Series High-Definition Oscilloscope
The DLM5000HD series sets a new standard for high-definition oscilloscopes.
- 4 or 8 analog channels
- 16-bit logic + optional additional 16-bit logic
- Bandwidth: 350 or 500 MHz
- Sample Rate: up to 2.5 GS/s
- Vertical resolution: 12 bit
- High resolution mode: up to 16 bit
- Measurement memory: up to 1 GigaPoints
- History waveforms: up to 200,000 triggers
- Synchronization function for up to 16 analog channels
- Logic and Serial Bus Analysis

