SB5000 Vehicle Serial Bus Analyzer (DISCONTINUED)


Advanced Functions for FlexRay Waveform & Protocol Analysis Comprehensive In-Vehicle Serial Bus Analyzer
The SB5000 Vehicle Serial Bus Analyzer is an invaluable tool for engineers involved in the development and use of in-vehicle communication buses. It can analyze FlexRay, an emerging bus technology employed by advanced ECU's and electronic vehicle control applications. Because it can measure logic signals of up to 32 bits simultaneously, a single SB5000 offers measurement and analysis of parallel bus signals from microprocessors and other sources.
The SB5000 is a powerful Serial Bus Analyzer with features to support your applications.
- FlexRay, CAN, LIN, UART, I²C, and SPI bus triggers and analysis
- FlexRay eye-diagram analysis
- FlexRay SI Voting Procedures Analysis ** New
- Characterizes electrical characteristics parameters of the FlexRay bus driver
- CAN/FlexRay* bus symbolic triggering, analysis, decoding, and trend display (Supports DBC database for CAN, FIBEX database for FlexRay)
- 4 ch analog + 8-bit logic (SB5310)
- 4 ch analog + 32-bit logic (SB5710)
- Up to 5 GS/s, 1 GHz bandwidth, 6.25 MW (Mpts) memory
- Auto Setup Dedicated to Serial Busses
* Available on the firmware version 4.20 or later.
FlexRay
Easy and efficient observation of the physical layer and simultaneous protocol analysis enable you to evaluate the performance of your FlexRay communication system. Evaluation and test through long-duration (multiple-cycle) bus observation answer questions such as whether specific frames are being transferred as designed, whether there are any "glitches" in signals, or whether any data corruption is occurring. The FlexRay FIBEX symbolic triggers, analysis and trend display functions* allow you to activate trigger and display the analysis results by physical values (Message and Signal) in conformity to FIBEX database.
| In addition to Frame Start, ID, Cycle Count, Data, and other conditions, the SB5710/SB5310 serial bus analyzer allows you to trigger on CRC, BSS, and FES errors to capture physical layer voltage waveforms. The protocol analysis results list and decode displays are shown simultaneously with the waveform display which is updated in real time on every trigger (Figure 1). If a communication abnormality occurs, this helps you to identify causes including whether the problem is hardware or software related. The analysis results list can be saved to a text file in csv format. You can make a "Field Jump" in the zoom screen to the top of a specific field in a specific frame (the CRC field, for example), or search the entire range of captured data for the field's waveform by specifying field and frame conditions. |

Figure.1: FlexRay waveform, list, decode display example
|
 Figure.2 FlexRay FIBEX symbolic decode, analysis list display example
FlexRay Eye-Diagram Analysis
 Figure.3 Eye Parameter Items  Figure.4 Eye diagram analysis example |
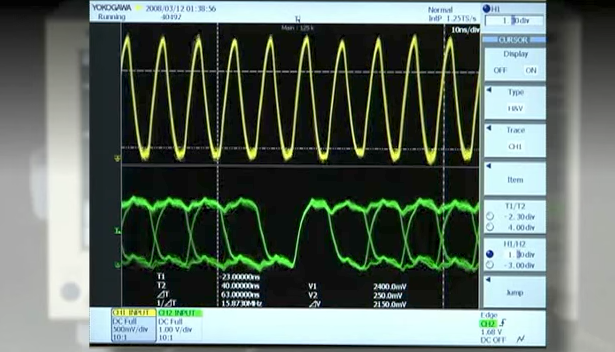
With the SB5710/SB5310, you can perform mask and eye parameter tests (Figure 3) conforming to the eye-diagram evaluation methods defined by the Flex-Ray Physical Layer Conformance Test Specification. From the accumulated test pulses, you can perform the mask test to calculate the number of abnormal pulses, number of waveform samples in the abnormal portion, and their ratio, and display the results. You can also perform the same mask and eye parameter tests on a specific bit specified in the onscreen zoom box (Figure 4). Up to six mask patterns, including ones defined by the FlexRay specifications, can be stored in the unit and recalled as needed according to the type of test to be performed. You can also edit masks after recalling them. |
SI Voting Procedures Analysis NEW
(World's first as a digital oscilloscope-based instrument, as of March 2009, investigated by Yokogawa)
The FlexRay Consortium Physical Layer Working Group is developing an "SI (System Integrity) Voting Procedure" in order to ensure that the Electrical Physical Layer performs correctly. With the new 4.42 firmware and later versions, the SB5000 carries out this advanced function, in addition to physical layer waveform observation and protocol analysis. Please refer to the "white paper", for detail of SI Voting Procedure and our solution.

Figure.5 SI Voting Analysis Example
Testing the Electrical Characteristics of the Bus Driver
The SB5710/SB5310 comes with functions for calculating parameters required for electrical characteristics tests of the bus driver (timing measurements of the transmitter and receiver operation). By simply selecting parameters for the source channel and the circuit under test in an easy-to-understand graphical menu, you can easily determine various delay times, rise/fall time, absolute value of differential voltage, and other values.
Evaluating Fluctuations in Communication Delay and Cycle Time
| The SB5710/SB5310 measures BSS bit time intervals from captured FlexRay communication data, and can also calculate relevant statistics (Figure 6). It supports time interval measurements and statistical calculation of every BSS, every BSS in frames of a specific ID, and the first BSS in specified frames or cycles. |  Figure.6 Exampe of electrical characteristics parameters of the FlexRay bus driver  Figure.7: Example of statistical processing of BSS time interval |
Symbolic Triggering, Analysis, and Trend Display
| You can load physical value definition files (FIBEX database files with extension .xml), enter trigger settings based on physical values (Message and Signal), and display analysis results as physical values (decoding). You can read physical values directly from waveforms, allowing increased efficiency of troubleshooting and analysis of faults in the FlexRay network. Also, you can specify a particular Message/Signal from the captured FlexRay data and display its physical values in a trend graph (Figure 8). The dedicated PC-software for Symbol definition (Symbol Editor) allows you to convert from FIBEX Database file into physical (Message, Signal) value file. Then the physical value file can be imported into the SB5710/SB5310. The Symbol definition (Symbol Editor) can be free downloaded from here.
|

CAN Bus
In-vehicle networks are standardized by specific use, and the optimal protocol is used for each application. The SB5710/SB5310 supports analysis of CAN, today's standard backbone network and control protocol. Like the Flex-Ray analysis functions, the instrument comes standard with abundant CAN bus triggers and robust analysis functions.
 Figure.9: CAN waveform, list, decode display example |
It is also equipped with dedicated CAN triggers including Start of Frame, ID, Data, Remote Frame, and Error Frame. Additionally, you can now set up to four ID and Data combination bit conditions and activate triggers based on OR relationships of these combinations. With the protocol analysis results list which is shown in a time series fashion (Figure 9), you can check each frame's analysis results (frame type, time from trigger point, ID, DLC, Data, and CRC), presence/absence of Ack, and the association with corresponding waveforms in a single screen. You can specify the type and other characteristics of fields and frames and search for corresponding waveforms in the captured CAN frame data. |
Analysis and Waveform Display of Two Busses Simultaneously
| You can analyze two CAN bus signals of differing conditions (for example, Hi-Speed and Low-Speed CAN) simultaneously, and display the analysis results along with waveforms. This allows verification of the correlation between the data on the upstream (backbone) network CAN bus and the downstream (sub) network. You can observe bus waveforms of different bit rates by zooming one each in the two zoom areas (Figure 10). |  Figure.10 Example of 2-bus simultaneous waveform and decode display |
Symbolic Triggering, Analysis, and Trend Display
You can load physical value definition files (DBC database files with extension .dbc), enter trigger settings based on physical values (Message and Signal), and display analysis results as physical values (decoding). You can read physical values directly from waveforms, allowing increased efficiency of troubleshooting and analysis of faults in the CAN network. Also, you can specify a particular Message/Signal from the captured CAN data and display its physical values in a trend graph (Figure 12).
The dedicated PC-software for Symbol definition (Symbol Editor) allows you to convert from DBC Database file into physical (Message, Signal) value file. Then the physical value file can be imported into the SB5710/SB5310.
The Symbol definition (Symbol Editor) can be free downloaded fromhere.

LIN Bus
| Comprehensive triggering, powerful analysis tools, and captured data searching functions are also provided for the LIN bus (body subnetwork). And speaking of triggers, the SB5710/SB5310 is equipped with not only Break + Synch and ID/Data (combinable) conditions, but also with a wealth of error triggers. This is one of the major features of the SB5000 series. You can capture bus waveforms when the various errors defined by the LIN protocol specifications (Parity, CheckSum, TimeOut, etc.) occur, and check those waveforms and the protocol analysis results (list) along with the error information. You can analyze both LIN revision 1.3 and 2.0 conformity data existing on the same bus line simultaneously. |  Figure.13 LIN trigger setting example  Figure.14 LIN waveform, list, decode display example  Figure.15 LIN revision 1.3 and 2.0 simultaneous decode, analysis display example |
Combination Triggers: Create triggers consisting of in-vehicle bus events and events on other channels
(e.g., a sensor input, or another in-vehicle bus event) (Event Interval Trigger)
 |
Figure.16 Event Interval trigger setting example |
UART
From CPU communication data in the ECU (electric control unit) to communication signals in manufacturing facilities, communication via a general purpose UART is carried out in a broad range of fields - among them, automobile development. The SB5710/SB5310 supports general-purpose UART trigger and analysis functions. Figures 17 and 19 show examples of the UART trigger setting screen and the waveform and analysis results display, respectively.

Check Signal Conditions When Trouble Occurs with Flexible UART Triggers and Error Triggers
In addition to specifying conditions of 8-bit data (with/without parity bit) and 7-bit data + parity bit, the UART trigger function supported by the SB5710/SB5310 can search for and trigger on parity and framing errors. Analysis number, time from trigger position, binary and hexadecimal notation of data, errors, and other added information can be linked with the waveforms and displayed in the same screen as analysis results.
I²C, SPI Buses
|
|
The SB5710/SB5310 also comes standard with trigger and analysis functions for the I²C and SPI general-purpose serial buses that are widely used as internal buses in car navigation and car audio systems. Figure 20 shows an example of measurement on an I²C bus, and Figure 21 gives an example of simultaneous display of waveform capturing and the analysis results list on the SB5710/SB5310. With the new firmware version 4.42 or later, the SPI analysis function without CS(Chip Select) source assignment is available. Some SPI bus applications do not require CS signal. Also, the data field size and the enabled bit range for analysis can be specified. The SB5000 can be applied for more wide-ranging SPI application. The various kinds of serial bus analysis functions required in the automobile development process come standard on the SB5710/SB5310; a single instrument supports development and evaluation in a variety of scenarios.
|

Making It Easier
Dedicated Menus and Auto Setup Dedicated for Serial Busses
|
The SB5710/SB5310 represents our constant pursuit of "more analysis functions that are easier-to-use." All in-vehicle serial bus analysis functions can be intuitively accessed and operated by following a menu displayed with the "SERIAL BUS SETUP" key. Furthermore, using the Auto setup function dedicated for serial buses, you can have the instrument automatically enter settings for record length, time axis (T/div), triggers, and analysis by simply specifying bus type and source (input) channel. After that, it will automatically display bus waveforms and analysis results (list and decoding). This frees you from tedious analysis setup. |
|
| Figure.22 Dedicated setup display for serial buses |


Figure.23 Serial bus auto setup function
Logic Signal (Parallel Bus) Measurement and Analysis
The SB5710/SB5310 can simultaneously measure and analyze logic signals of up to 32-bits (available as 32-bit or 8-bit models). It is effective for ECU debugging because simultaneous measurement and analysis applies not only to in-vehicle serial buses (measured on analog channels), but also to parallel bus signals. The SB5710/SB5310 also supports the state display and bus display functions that is standard on logic analyzers. The fast screen update rate is maintained even when measuring analog and logic signals at the same time. Measuring logic signals requires the model 701980 or 701981 logic probe (sold separately).

Save Only the Data You Need & Extract Only the Abnormal Waveforms
History Memory & Search
The SB5710/SB5310 divides its built-in 6.25 MW (Mpts) memory into a maximum of 2000 segments, and automatically saves the waveform data captured with the wide assortment of in-vehicle serial bus triggers into these segments. It comes equipped with a History Memory function that can recall past waveforms stored in the individually divided memory in this manner. No special settings whatsoever are required. This convenient function saves screen-updated waveform data to the automatically divided memory, and can recall it. With the History Memory, you can efficiently load only the needed portion of data captured by triggers into memory while monitoring the bus. Also, abnormal bus waveforms with unexpected glitches or noise can be extracted (searched for) from the History Memory and zoomed.
 |
|
| Figure.26 Multiple waveforms can be saved automatically into History Memory | Figure.27 The History Memory function allows you to call up a maximum of 2,000 previously acquired waveforms and analyze the retained waveform data. |

History Replay
Divided and captured waveforms in History Memory can be checked retroactively with protocol analysis results one at a time, as if flipping through a Rolodex. Also, the History Replay function can play back, stop, fast-forward, and rewind captured waveforms continuously as an animated image.
Versatile Connectivity

- Probe power (Factory-set option)
- GO/NO-GO I/O - Can be used to output the results of either GO/NO-GO tests or mask tests for communication purposes as a TTL level signal.
- USB-PC connection port - Can be used to control SB5710/SB5310 externally or to upload data from the SB5710/SB5310 to a PC.
- Video OUT - Can be connected to an external monitor.
- Trigger I/O - Separate ports available for external trigger input and output.
- 100BaseTX/10BaseT Ethernet (Factory-set option)
- PC Card Slot - A PC card slot is standard. A National Instruments' PCMCIA-GPIB card is required to be able to use the GPIB interface.
- Logic Inputs - Logic probe connectors. One or Four 8-bit logic probes can be connected. (701980 or 701981)

/C12 LXI Compliant Ethernet Interface Options
 LXI (Lan eXtensions for Instrumentation) is a communication platform for test & measurement instruments, built on LAN technology. It provides improved transfer speeds with improved usability and low cost, when compared to traditional instrument interfaces. It's easy to migrate over from traditional GPIB system, because LXI utilizes existing technologies such as VXI-11 or IVI.
The Yokogawa DL9000/DL9700/9500 series and SB5000, with the LXI compliant Ethernet option ( /C12) installed, are fully compliant with LXI Class C.
Currently, over 20 test and measurement manufacturers provide LXI compliant products, and the total number of supported products is above 1100. As a new communication platform for applications requiring high transfer speed, low cost and usability, LXI will become more widespread in the future. For more information on LXI, please visit the LXI Consortium.
| Model | Description |
|---|---|
| SB5710 | 4ch 1GHz + Logic 32bits, Max. 5 GS/s(2.5 GS/s/ch), 6.25 MW/ch |
| SB5310 | 4ch 1GHz + Logic 8bits, Max. 5 GS/s(2.5 GS/s/ch), 6.25 MW/ch |
Modes d'emploi
- Model 701983 RACK MOUNTING KIT For an EIA-compliant Single-housing Rack (753.9 KB)
- Model 701983 RACK MOUNTING KIT For a JIS-compliant Single-housing Rack (754.6 KB)
- Regarding the SB5000 Series Vehicle Serial Bus Analyzer Communication Interface User's Manual CD-ROM (119.2 KB)
- DL9000/DL6000/DLM6000/SB5000 USB Driver Installation Manual (709.7 KB)
- Sample Program for the DL9000/SB5000/DL6000/DLM6000 Series Digital Oscilloscope Read this first. (171.4 KB)
- SB5000 Series Vehicle Serial Bus Analyzer USER'S MANUAL (16.5 MB)
- SB5000 Series Vehicle Serial Bus Analyzer Communication Interface USER'S MANUAL (5.9 MB)
- SB5000 Series Vehicle Serial Bus Analyzer OPERATION GUIDE (3.5 MB)
- DL9000 Series Digital Oscilloscopes/SB5000 Series Vehicle Serial Bus Analyzer Power Supply Analysis Function (772.0 KB)
Software
- Mask Pattern Editor
- Symbol Editor
- Binary Data File Converter
- Xwirepuller
- Xviewer 701992 / XviewerLITE
- Communication Sample Programs
- TMCTL
- USB Drivers
- LabVIEW Drivers for DL9000, SB5000, DL6000/DLM6000 Series ( NATIONAL INSTRUMENTS Web Page )