Three Ways to Measure Pulsed Light with an Optical Spectrum Analyzer
Overview of Pulsed Light Measurement
Why use pulsed light?
A semiconductor laser emits light by supplying a driving current. However, the drive current causes the semiconductor laser chip itself to generate heat, causing a shift in the output wavelength. In the worst case, the heat can damage the laser. To avoid such problems, pulse-driven light emission is widely used. In addition, in the case of lasers for material processing that require a high-power laser beam, in order to generate a high-power laser beam, the power is accumulated for a certain period of time, and then it is emitted with a short pulse. The pulse drive conditions of these lasers are designed with repetition frequency and duty ratio depending on the application. In order to accurately measure these pulsed lights using an optical spectrum analyzer (OSA), it is necessary to understand the characteristics of the OSA and select the appropriate measurement method and settings.
Challenges of pulsed light measurement by OSA
OSA samples and measures the total power of a specific wavelength segment while sweeping the wavelength, and displays it as an optical spectrum. Normally, it is assumed that the optical input signal is constant during the OSA wavelength sweep. In other words, a signal that turns the optical input signal on / off like pulsed light is not expected. Therefore, if the OSA measurement method and condition settings are not suitable for the pulsed light drive conditions, the measured spectrum may appear segmented or choppy as shown below.

Pulsed light measurement by Yokogawa OSA
Yokogawa's OSA offers three types of measurement methods, "time average spectrum measurement", "peak hold measurement", and "external trigger synchronous measurement", depending on the driving conditions of the pulsed light.
- Time average spectrum measurement: The average power of the pulsed light is measured as the power of the light spectrum. It can be used even when the pulse width is narrow.
- External trigger synchronous measurement: By supplying the pulsed signal from the light source as an external electrical trigger signal synchronized with the optical pulse to the OSA, the peak value of the optical pulse is captured. The measurable pulse width is 50 μs or more.
- Peak hold measurement: Captures the peak value within the repeating cycle of the optical pulse. The measurable pulse width is 100 μs or more.
| Measurement modes | AQ6360 | AQ6370 | AQ6375 |
|---|---|---|---|
| AQ6373 | AQ6376 | ||
| AQ6374 | AQ6377 | ||
| Time average spectrum | ● | ● | ● |
| External Trigger | ● | ○ | |
| Peak Hold | ● | ○ |
● : Available
○ : Available (conditional*)
Figure 2: Applicable measurement modes per OSA model.
Note. The external trigger and peak hold measurements are not available in HIGH1, HIGH2, and HIGH3 of AQ6375, AQ6376, and AQ6377 where the high dynamic range "CHOP“ mode is used.
Note. AQ6380 can measure Pulsed Light in “TRAD” mode only.
Pulsed Light Measurement in Time Average Mode (normal mode)
In the time average mode, the time average power of pulsed light is measured as the optical spectral power of each wavelength. When the pulsed light is a square wave, the measured average light power is calculated as (peak power of light pulse [mW]) × (duty ratio of pulsed light). Therefore, the smaller the duty ratio of pulsed light, the lower the measured power. In order to measure the average power correctly in this mode, the repetition frequency must be high to some extent. Otherwise, it may need to be measured in a high sensitivity setting or by increasing the number of averages.
Therefore, the smaller the duty ratio of pulsed light, the lower the measured power. To measure the average power correctly in this mode, the repetition frequency must be high to some extent. Otherwise, it may need to be measured in a high-sensitivity setting or by increasing the number of averages.
Features of time average mode
- No external trigger signal required.
- Cannot handle irregular pulse signals. (Because the average power fluctuates)
- It can handle any signal such as short pulse and long repetition period.
- High power pulsed light with peak power exceeding 1W can be measured. However, there are limits on maximum pulse peak power and maximum safe average power.
- The measured optical power is low, because the average power of the optical pulse is measured. Therefore, there are likely to be cases where measurement is not possible due to insufficient power. To ensure a high dynamic range, it is necessary to use a high sensitivity setting, which slows down the measurement. If the average power is high, it could measure faster than other methods.
- There are restrictions on sensitivity setting depending on the repetition frequency. Therefore, when the repetition frequency is low, the measurement sensitivity needs to be increased, which slows down the measurement.
- High dynamic range mode (CHOP), double speed mode, averaging function can be applied.
Constraints on sensitivity setting by repetition frequency
The pulse repetition frequency can be roughly divided into the following three groups, and the measurement method can be considered accordingly.
- Pulse repetition frequency (MHz): At very high pulse repetition frequencies, the reaction speed of the detection circuit in the OSA is slow enough even at the lowest sensitivity setting (NORM HOLD), so the OSA can measure it like a continuous wave regardless of the device setting. Therefore, set the sensitivity according to the average power.
- Pulse repetition frequency (kHz): For kHz class pulse repetition frequencies, on / off distortion due to pulsed light may be noticeable. This effect can be eliminated by selecting a high sensitivity setting and slowing down the reaction speed of the detection circuit. Therefore, it is necessary to set the sensitivity considering both the average power and the repetition frequency.
- Pulse repetition frequency (Hz): If the pulse repetition frequency is very low, set the sensitivity considering the repetition frequency. If the highest sensitivity setting does not eliminate the distortion of the recorded spectrum, add an averaging process. Assuming that the number of averaging is n, the minimum repetition frequency of each sensitivity setting is multiplied by 1 / n. However, adding the number of averaging will significantly reduce the measurement speed, so use it only when the maximum sensitivity setting is insufficient.
Estimated minimum repetition frequency
The table on the right shows the minimum repeat frequency that can be measured with each sensitivity setting.
- For models with high dynamic range mode selection, includes when high dynamic range mode is ON.
- HIGH1-3 of AQ6375/76/77 is in high dynamic range mode (CHOP) and the averaging does not reduce the minimum repeat frequency in this mode.
| Minimum repetition frequency | |||
|---|---|---|---|
| Sensitivity setting | AQ6360 | AQ6370 | AQ6375 |
| AQ6373 | AQ6376 | ||
| AQ6374 | AQ6377 | ||
| NORM/HOLD | 1 MHz | 200 kHz | 200 kHz |
| NORM/AUTO | 1 MHz | 100 kHz | 100 kHz |
| NORMAL | 200 kHz | 33 kHz | 33 kHz |
| MID | 50 kHz | 10 kHz | 10 kHz |
| HIGH1 | 10 kHz | 3.3 kHz | 1 MHz |
| HIGH2 | 2 kHz | 660 Hz | 1 MHz |
| HIGH3 | N/A | 160 Hz | 1 MHz |
Optical input power conditions
The time average mode can measure high power pulsed light with a peak power of more than 1W. However, pulsed light of which average spectral power exceeds the OSA maximum input power specification cannot be measured.
* Maximum input power is the maximum spectral power per measurement resolution.
| Maximum input power |
AQ6360 | AQ6370 | AQ6373 | AQ6374 | AQ6375 | AQ6376 | AQ6377 | ||
|---|---|---|---|---|---|---|---|---|---|
| 400 – 550 nm | 550 – 1100 nm | 400 – 550 nm | 550 – 1750 nm | ||||||
| dBm | +20 | +20 | +10 | +20 | +10 | +20 | +20 | +13 | +13 |
| W | 0.1 | 0.1 | 0.01 | 0.1 | 0.01 | 0.1 | 0.1 | 0.02 | 0.02 |
Pulsed light measurement in external trigger mode
The External trigger mode is a mode that uses an external trigger signal to control the timing of OSA measurements. By supplying an external trigger signal synchronized with the optical pulse signal to the OSA, the peak value of the optical pulse can be captured. OSA takes one sample from one laser pulse. OSA increments to the next wavelength step and records the output signal of the detection circuit each time one trigger is input. (See manual for electrical properties of trigger signal)
Features of external trigger mode
- Requires an external trigger signal synchronized with the optical pulse.
- It can handle irregular pulse signals.
- The max. optical pulse peak power is the maximum input power of OSA. (For AQ6370, +20 dBm)
- The minimum optical pulse width is 50 μs (for Norm/Hold sensitivity) However, the minimum pulse width depends on the sensitivity setting. Higher sensitivity settings increase the minimum pulse width.
- Since the peak power of the optical pulse is captured, the optical power measured is higher than that of the time average mode. Therefore, problems due to insufficient power are unlikely to occur. In addition, measurement is fast because a high dynamic range can be secured even with a low sensitivity setting.
- There are no restrictions on sensitivity setting depending on the repetition frequency. Therefore, it is easy to speed up the measurement using the low sensitivity setting.
- High dynamic range mode (CHOP), double speed mode, and averaging function cannot be applied.
Minimum pulse width condition
The external trigger mode requires a pulse width of at least 50 μs to capture the peak of the optical pulse. In addition, the minimum pulse width depends on the measurement sensitivity setting used, and the higher the measurement sensitivity, the wider the minimum pulse width at which peaks are captured. Therefore, the suitability of this mode is mainly determined by the pulse width to be measured. The reason is that the gain of the detection circuit and the response speed are inversely proportional. At low sensitivity settings, the detection circuit gain is low and the response is fast, allowing short pulse width peaks to be measured correctly. However, at high sensitivity settings, the gain of the detection circuit is high and the response is slow, so short pulse width peaks cannot be measured correctly.
The table below shows the min. pulse width that can be measured with each sensitivity setting.
| Minimum pulse width | ||
|---|---|---|
| Sensitivity setting |
AQ6370 | AQ6375 |
| AQ6373 | AQ6376 | |
| AQ6374 | AQ6377 | |
| NORM/HOLD | 50 μs | 50 μs |
| NORM/AUTO | 300 μs | 300 μs |
| NORMAL | 1 ms | 1 ms |
| MID | 3 ms | 3 ms |
| HIGH1 | 10 ms | - |
| HIGH2 | 50 ms | - |
| HIGH3 | 200 ms | - |
External trigger and timing adjustment
-
To measure the peak power of the optical pulse, connect an external trigger signal synchronized with the optical pulse to the [TRIGGER IN] port on the back of the OSA, and set [TRIG INPUT MODE] in the OSA SYSTEM menu to [SMPL TRIG MODE].
-
The SMPL TRIGGER MODE triggers at the rising edge (or falling edge) of the input external trigger signal to measure 1 point.
-
Adjust the timing as needed to capture the peak of the optical pulse correctly. OSA has a delay from trigger to measurement, about 1 μs for AQ6380 and about 20 μs for AQ6370 series. It also has a function to add a delay time in the range of 0 to 1000 μs.
Optical input power conditions
In external trigger mode, OSA captures the peak power of the optical pulse, so optical pulsed light that exceeds the OSA maximum input power specifications cannot be measured. Therefore, the peak power of a measurable optical pulse is at most +20 dBm (0.1 W). The maximum input power of each model is shown in the table below.
- Maximum input power is the maximum spectral power per measurement resolution.
| Maximum input power |
AQ6360 | AQ6370 | AQ6373 | AQ6374 | AQ6375 | AQ6376 | AQ6377 | ||
|---|---|---|---|---|---|---|---|---|---|
| 400 – 550 nm | 550 – 1100 nm | 400 – 550 nm | 550 – 1750 nm | ||||||
| dBm | +20 | +20 | +10 | +20 | +10 | +20 | +20 | +13 | +13 |
| W | 0.1 | 0.1 | 0.01 | 0.1 | 0.01 | 0.1 | 0.1 | 0.02 | 0.02 |
Pulsed light measurement in peak hold mode
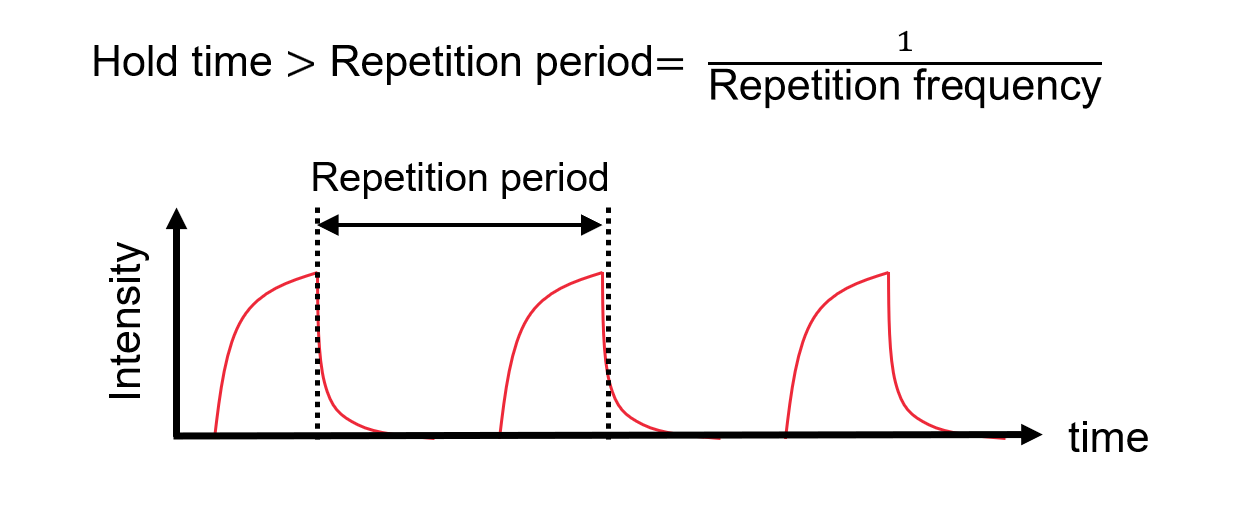
Peak hold mode is a measurement mode that does not require an external trigger signal. In peak hold mode, the detection signal is recorded for the specified period for each measurement wavelength, and the maximum value of the data acquired during that period is used as the power for that measurement wavelength. The period during which the detection signal is recorded is called the "hold time" and is set to a value larger than the pulse repetition period (1 / repetition frequency). Which allows to measure at least one pulse within the hold time. OSA basically takes one sample from one laser pulse and repeats the movement of the measurement wavelength and the recording of the output signal of the detection circuit.
Features of peak hold mode
- No external trigger signal required.
- The max. optical pulse peak power is the maximum input power of OSA. (For AQ6370, +20 dBm)
- The minimum optical pulse width is 100 μs (for Norm/Hold) However, the minimum pulse width depends on the sensitivity setting. Higher sensitivity settings increase the minimum pulse width.
- Since the peak power of the optical pulse is captured, the optical power measured is higher than that of the time average mode. Therefore, problems due to insufficient power are unlikely to occur. In addition, measurement is fast because a high dynamic range can be secured even with a low sensitivity setting.
- There are no restrictions on sensitivity setting depending on the repetition frequency. Therefore, it is easy to speed up the measurement using the low sensitivity setting.
- High dynamic range mode (CHOP), double speed mode, and averaging function cannot be applied.
- Not recommended for measuring irregular pulse signals. Because it is necessary to set the hold time according to the minimum repetition frequency.
Minimum pulse width condition
The peak hold mode requires a pulse width of at least 100 μs to capture the peak of the optical pulse. In addition, the minimum pulse width depends on the measurement sensitivity setting used, and the higher the measurement sensitivity, the wider the minimum pulse width at which peaks are captured. Therefore, the suitability of this mode is mainly determined by the pulse width to be measured. The reason is that the gain of the detection circuit and the response speed are inversely proportional.
At low sensitivity settings, the detection circuit gain is low and the response is fast, allowing short pulse width peaks to be measured correctly. However, at high sensitivity settings, the gain of the detection circuit is high and the response is slow, so short pulse width peaks cannot be measured correctly.
The table below shows the min. pulse width that can be measured with each sensitivity setting
| Minimum pulse width | ||
|---|---|---|
| Sensitivity setting |
AQ6370 | AQ6375 |
| AQ6373 | AQ6376 | |
| AQ6374 | AQ6377 | |
| NORM/HOLD | 100 μs | 100 μs |
| NORM/AUTO | 300 μs | 300 μs |
| NORMAL | 1 ms | 1 ms |
| MID | 3 ms | 3 ms |
| HIGH1 | 10 ms | - |
| HIGH2 | 50 ms | - |
| HIGH3 | 200 ms | - |
Hold time setting
Set the hold time to a value larger than the pulse repetition period (1 / repetition frequency). In OSA, the hold time can be set arbitrarily within the range of 0 to 9999 ms. Therefore, it can measure down to a pulse repetition frequency of 0.1 Hz.
Optical input power conditions
In Peak hold mode, OSA captures the peak power of the optical pulse, so optical pulsed light that exceeds the OSA maximum input power specifications cannot be measured. Therefore, the peak power of a measurable optical pulse is at most +20 dBm (0.1 W). The maximum input power of each model is shown in the table below.
* Maximum input power is the maximum spectral power per measurement resolution.
| Maximum input power |
AQ6360 | AQ6370 | AQ6373 | AQ6374 | AQ6375 | AQ6376 | AQ6377 | ||
|---|---|---|---|---|---|---|---|---|---|
| 400 – 550 nm | 550 – 1100 nm | 400 – 550 nm | 550 – 1750 nm | ||||||
| dBm | +20 | +20 | +10 | +20 | +10 | +20 | +20 | +13 | +13 |
| W | 0.1 | 0.1 | 0.01 | 0.1 | 0.01 | 0.1 | 0.1 | 0.02 | 0.02 |
Guidelines for pulsed light input power
When measuring pulsed light, it is recommended to use the pulse peak power below the maximum safe input power of the OSA to prevent damage inside the equipment. However, since it is considered that the limitation differs depending on the emission condition of the pulsed light, some conditions are described below. It should be noted that these conditions are merely estimated values and do not guarantee safety.
When the pulse width exceeds 1 µs
-
The pulse peak power must not exceed the OSA maximum safe input power.
When the pulse width is 1 µs or less
- The pulse peak power must not exceed 316W.
- The averaged power must not exceed the OSA maximum safe input power.
- The average power is calculated from:
- Pulse peak power (W) × pulse width (s) ÷ repetition cycle (s), or
- Pulse peak power (W) × pulse width (s) × repetition frequency (Hz)
| Maximum input power |
AQ6360 | AQ6370 | AQ6373 | AQ6374 | AQ6375 | AQ6376 | AQ6377 | ||
|---|---|---|---|---|---|---|---|---|---|
| 400 – 550 nm | 550 – 1100 nm | 400 – 550 nm | 550 – 1750 nm | ||||||
| dBm | +25 | +25 | +10 | +20 | +10 | +20 | +25 | +20 | +20 |
| W | 0.316 | 0.316 | 0.01 | 0.1 | 0.01 | 0.1 | 0.316 | 0.1 | 0.1 |


 Figure 10. How to obtain the maximum pulse peak power from pulse conditions.
Summary of the Guidelines
- Comply with “Guideline for pulsed light input power.”
- Use the time average mode
- Time averaging mode is the easiest and most flexible way to measure pulsed light.
- Consider External trigger mode and Peak hold mode when you encounter issues with Time average mode
- For example:
- For irregular pulsed light
- Measurement is not possible. Because the average power is below the measurement sensitivity due to the relationship between the peak power and the duty ratio.
- Measurement takes too long because the high sensitivity setting is required due to very low repetition frequency.
- For example:
- External trigger mode or Peak hold mode
- Determine suitability by the pulse width and the required sensitivity setting.
- Chose one by the availability of an external trigger and the minimum pulse width.
| Time averaging mode (normal mode) | External trigger mode | Peak hold mode | |
|---|---|---|---|
| External trigger | No | Required | No |
| Irregular pulse | Not applicable | Applicable | Applicable but not recommended |
| Minimum pulse width | No restriction | 50 μs (NORM/HOLD) | 100 μs (NORM/HOLD) |
| Changes depending on sensitivity setting. | |||
| Maximum input power | High power pulse light with peak power exceeding 1W can be measured. However, there are restrictions on the maximum pulse peak power and maximum safe average power. Refer to the section “Guidelines for Pulsed Light Input Power” in this app note. | Pulse peak power must be less than or equal to the OSA's maximum input power (for AQ6370, 0.1 W or less). Refer to the maximum input power of each product in Figures 6 and 8. | |
| Measured power | Average power | Pulse peak power | |
| How to select sensitivity | First, refer to the repetition frequency, then the required dynamic range. | First, refer to the pulse width, then the required dynamic range. | |
| Selection guidelines | Regular pulse signal with a constant repetition frequency. Average power is above measurement sensitivity. |
The pulse width satisfies the condition for each sensitivity. Refer to the guideline for the minimum pulse width for each sensitivity setting in Figures 6 and 8. | |
| There is an external trigger signal. | N/A | ||
| Tips | Shorten the measurement time by increasing the repetition frequency. When the repetition frequency is extremely low, measurement becomes possible by increasing the number of averages. However, averaging leads to a significant increase in measurement time. It is not recommended to use anything other than the sensitivity setting HIGH3. |
If the repetition frequency is less than 20 Hz, it may be faster than the time average mode. | |
Examples (AQ6370)
Pulse width 100 µs, pulse peak power 0.1 W, repetition frequency 1 kHz
- Any measurement mode can be selected according to the pulse width condition. If there is an external trigger signal, select "external trigger". Otherwise, select "Peak Hold".
- For External trigger and Peak hold, make sure that the pulse peak is below “maximum input power".
| Mode | Pulse width | Pulse peak power | Repetition frequency | Sensitivity setting | Measured power | Noise level | Dynamic range | |
|---|---|---|---|---|---|---|---|---|
| Time average | 100 μs | 0.1 W | +20 dBm | 1 kHz | HIGH2 | +10 dBm | -85 dBm | 95 dB |
| External trigger | Norm/Hold | +20 dBm | -25 dBm | 45 dB | ||||
| Peak hold | Norm/Hold | +20 dBm | -25 dBm | 45 dB | ||||
Pulse width 50 µs, pulse peak power 0.1 W, repetition frequency 1 kHz
- "Time average" or "external trigger" can be selected according to the pulse width condition. Select "external if there is an external trigger signal since "external trigger" is faster.
- In the case of "external trigger", make sure that the pulse peak is below the maximum input power.
- In the case of "time average", make sure that the pulse peak is below the maximum safe input power according to the pulse width condition, and set the sensitivity setting to High 2 or higher according to the repetition frequency.
| Mode | Pulse width | Pulse peak power | Repetition frequency | Sensitivity setting | Measured power | Noise level | Dynamic range | |
|---|---|---|---|---|---|---|---|---|
| Time average | 50 μs | 0.1 W | +20 dBm | 1 kHz | HIGH2 | +7 dBm | -85 dBm | 92 dB |
| External trigger | Norm/Hold | +20 dBm | -25 dBm | 45 dB | ||||
Pulse width 1 µs, pulse peak power 0.1 W, repetition frequency 1 kHz
- Select "Time average" according to the pulse width condition.
- Make sure that the pulse peak is below the maximum safe input power according to the pulse width condition.
- Set the sensitivity setting to High 2 or higher according to the repetition frequency.
| Mode | Pulse width | Pulse peak power | Repetition frequency | Sensitivity setting | Measured power | Noise level | Dynamic range | |
|---|---|---|---|---|---|---|---|---|
| Time average | 1 μs | 0.1 W | +20 dBm | 100 kHz | Norm/Hold | +10 dBm | -55 dBm | 45 dB |
| 10 kHz | MID | 0 dBm | -75 dBm | 75 dB | ||||
| 1 kHz | HIGH2 | -10 dBm | -85 dBm | 75 dB | ||||
| 200 Hz | HIGH3 | -17 dBm | -90 dBm | 73 dB | ||||
Pulse width 1 ns, pulse peak power 10 W, repetition frequency 1 kHz
- Select "Time average" according to the pulse width condition.
- Make sure that the pulse peak is 316 W or less and the average power is below the maximum safe input power according to the pulse width condition.
- Set the sensitivity setting to High 2 or higher according to the repetition frequency.
| Mode | Pulse width | Pulse peak power | Repetition frequency | Sensitivity setting | Measured power | Noise level | Dynamic range | |
|---|---|---|---|---|---|---|---|---|
| Time average | 1 ns | 10 W | +40 dBm | 100 kHz | Norm/Hold | 0 dBm | -65 dBm | 45 dB |
| 10 kHz | MID | -10 dBm | -75 dBm | 65 dB | ||||
| 1 kHz | HIGH2 | -20 dBm | -85 dBm | 65 dB | ||||
| 200 Hz | HIGH3 | -27 dBm | -90 dBm | 63 dB | ||||
Appendix
The effect of an OSA’s sensitivity setting
The OSA sensitivity setting has a significant effect on the quality and duration of pulsed light measurements. In time average mode, the sensitivity setting limits the measurable pulse repetition frequency. On the other hand, in external trigger mode and peak hold mode, the minimum pulse width is limited. These are related to the response speed of the OSA detection circuit.
The OSA detection circuit is selected by the measurement sensitivity setting. Each circuit corresponds to each sensitivity setting and provides a specific gain and response speed. The gain and response speed are inversely related, and increasing the gain slows down the response speed. Therefore, at high sensitivity settings such as HIGH1, while the gain of the detection circuit increases, the reaction speed becomes slower and the wavelength sweep becomes slower. Conversely, with low sensitivity settings such as NORM-HOLD and NORMAL, the gain of the detection circuit is reduced, while the reaction speed is faster and the wavelength sweep is faster.
In time averaging mode, if the OSA responds too quickly compared to the pulse repetition frequency, there will be a clear on / off distortion in the recorded spectrum. Therefore, it is very important to select the appropriate measurement sensitivity for the pulse repetition frequency.
In external trigger mode and peak hold mode, peaks of short pulse width can be measured correctly at low sensitivity settings where the gain of detection circuit is low and the response is fast. However, at high sensitivity settings, the gain of the detection circuit is high and the response is slow, so short pulse width peaks cannot be measured correctly. Therefore, it is very important to select the appropriate measurement sensitivity for the pulse width to be measured.

OSA detection signal
- Laser output pulse signal
- Detection circuit output signal (low sensitivity)
In the low sensitivity setting, P (λ) is high because the response of the detection circuit is fast. The peak of the pulse is captured. - Detection circuit output signal (high sensitivity)
In the high sensitivity setting, P (λ) is low because the response of the detection circuit is slow. The peak of the pulse cannot be captured.

 Figure 18. Detection circuit output signal (low sensitivity).
 Figure 19. Detection circuit output signal (high sensitivity).
Operation in peak hold mode
At each wavelength, the pulse detector signal is recorded at specific time intervals. The maximum signal acquired at the time interval is used as the power value at a specific wavelength.

Related Industries
Related Products & Solutions

AQ6361 Telecom Production 1200 - 1700 nm
- 0.03 nm resolution
- ±20 pm accuracy
- 65 dB close-in dynamic range
- -80 dBm level sensitivity
- Highest sweep speed

AQ6370E Telecom 600 - 1700 nm
- 0.02 nm resolution
- ±8 pm accuracy
- 78 dB close-in dynamic range
- -90 dBm level sensitivity
- Single-mode and multi-mode

AQ6373E Visible Wavelength 350 - 1200 nm
- 0.02 nm resolution
- ±50 pm accuracy
- 60 dB close-in dynamic range
- -80 dBm level sensitivity
- Single-mode and multi-mode
- Industrial & biomedical laser testing

AQ6374E Wide Wavelength Range 350 - 1750 nm
- 0.05 nm resolution
- ±50 pm accuracy
- 60 dB close-in dynamic range
- -80 dBm level sensitivity
- Single-mode and multi-mode
- Visible to communications wavelengths

AQ6375E Long Wavelength 1000 - 2500 nm
- 0.05 nm resolution
- ±50 pm accuracy
- 55 dB close-in dynamic range
- 90 dB measurement dynamic range
- -70 dBm level sensitivity
- Single-mode and multi-mode
- Advanced pulsed light measurement (APLM) mode

AQ6376E Three Micron 1500 - 3400 nm
- 0.1 nm resolution
- ±0.5 nm accuracy
- 55 dB close-in dynamic range
- 78 dB measurement dynamic range
- -65 dBm level sensitivity
- Single-mode and multi-mode
- Advanced pulsed light measurement (APLM) mode

AQ6377E Five Micron 1900 - 5500 nm
- 0.1 nm resolution
- ±0.5 nm accuracy
- 50 dB close-in dynamic range
- 73 dB measurement dynamic range
- -60 dBm level sensitivity
- Single-mode and multi-mode
- Advanced pulsed light measurement (APLM) mode

AQ6380 Highest Performance 1200 - 1650 nm
- 0.005 nm (5 pm / 0.624 GHz) resolution
- ±5 pm accuracy
- 65 dB close-in dynamic range
- -85 dBm level sensitivity
- O, C, and L-bands

Optical Spectrum Analyzers
- High-resolution measurement of optical power vs wavelength
- Ideal for R&D, manufacturing, and laser characterization

Optical Test Equipment
Market-leading optical test solutions with best-in-class OSAs to validate fiber networks and next-generation photonics systems.

