Beyond AC Coupling: A Better Approach to DC Bus Ripple Measurement
Ripple analysis on DC buses is one of the most common measurements performed in power electronics. Engineers working on power supplies, motor drives, renewable energy systems, EV powertrains, and industrial converters routinely examine ripple on high-voltage DC buses to understand system behavior, validate filtering performance, and identify instability or unwanted interactions between power stages.
Although the DC bus may operate at hundreds of volts, the ripple riding on that bus is often very small, sometimes only tens or hundreds of millivolts. This large ratio between the DC level and the ripple signal makes ripple analysis challenging.
Why Engineers Analyze Ripple on DC Buses
Ripple on a DC bus contains valuable information about the dynamic behavior of a power system. Even small ripple components can reveal how energy is moving through converters, filters, and loads.
Typical reasons engineers measure DC bus ripple include:
Converter performance verification
Switching converters generate ripple at the switching frequency and its harmonics. Measuring this ripple helps engineers evaluate:
- Output filter effectiveness
- Capacitor selection
- Switching behavior and layout parasitics
Control loop behavior
Low-frequency ripple may indicate:
- Control loop oscillation
- Poor compensation
- Interaction between multiple regulators
Line-frequency modulation
In grid-connected systems, ripple at 50 or 60 Hz and its harmonics can appear on the DC bus due to power conversion stages.
Interaction between converters
In systems with multiple switching converters sharing a bus, ripple measurements may reveal:
- Beat frequencies between converters
- Cross-coupling through bus impedance
- Resonances in the bus capacitance network
Because ripple carries this much diagnostic information, accurate measurement of the ripple waveform is critical.
The Measurement Challenge
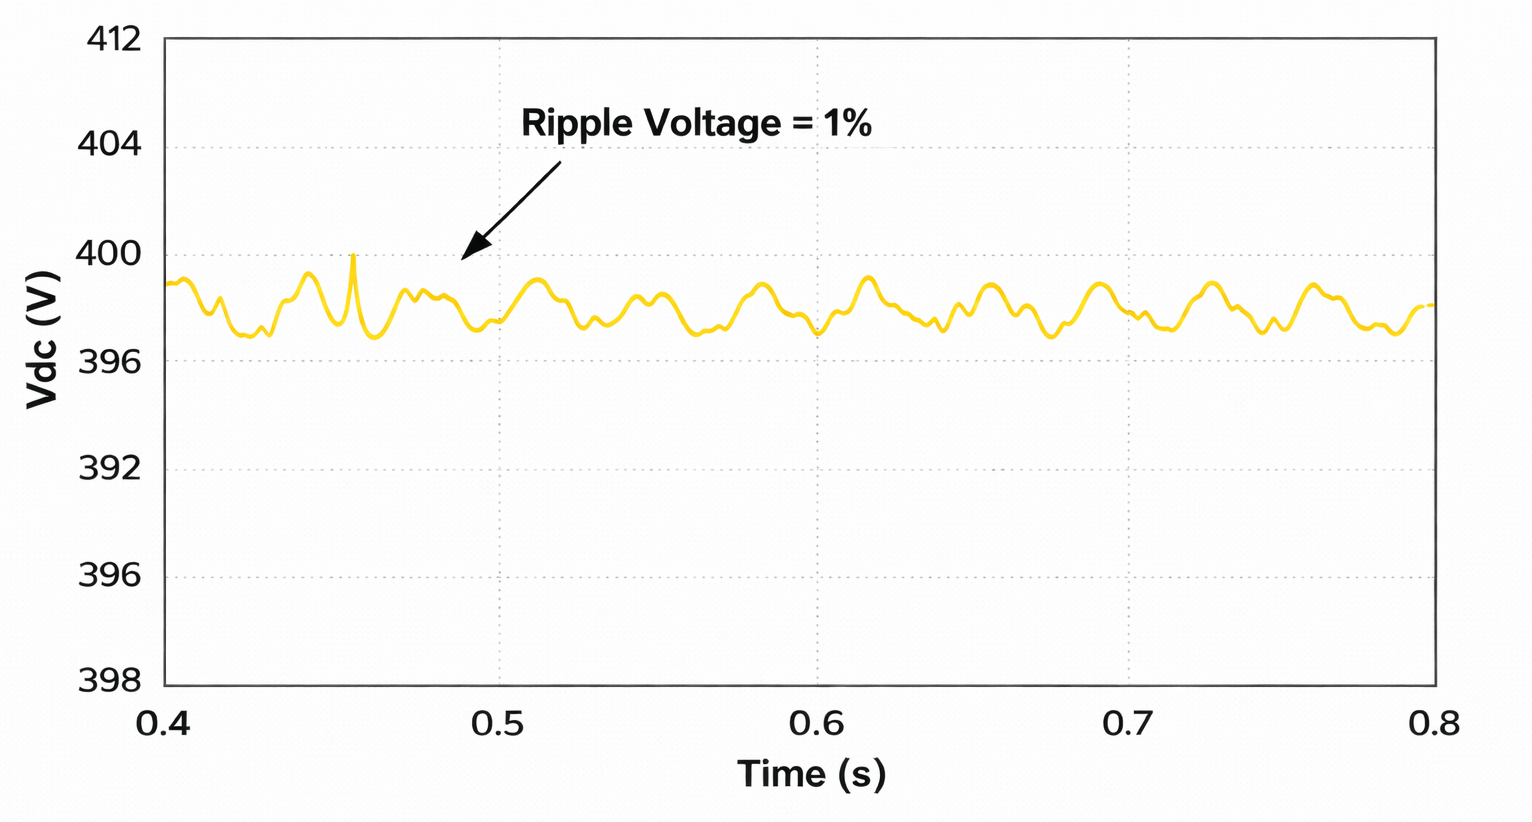
Consider a typical example:
| Paremeter | Example Value |
|---|---|
| DC Bus Voltage | 400V |
| Ripple Amplitude (±) | 2V |
| Ripple Percentage | 1% |
| Signal Ratio | 1 : 200 |
Displaying both signals simultaneously presents a challenge.
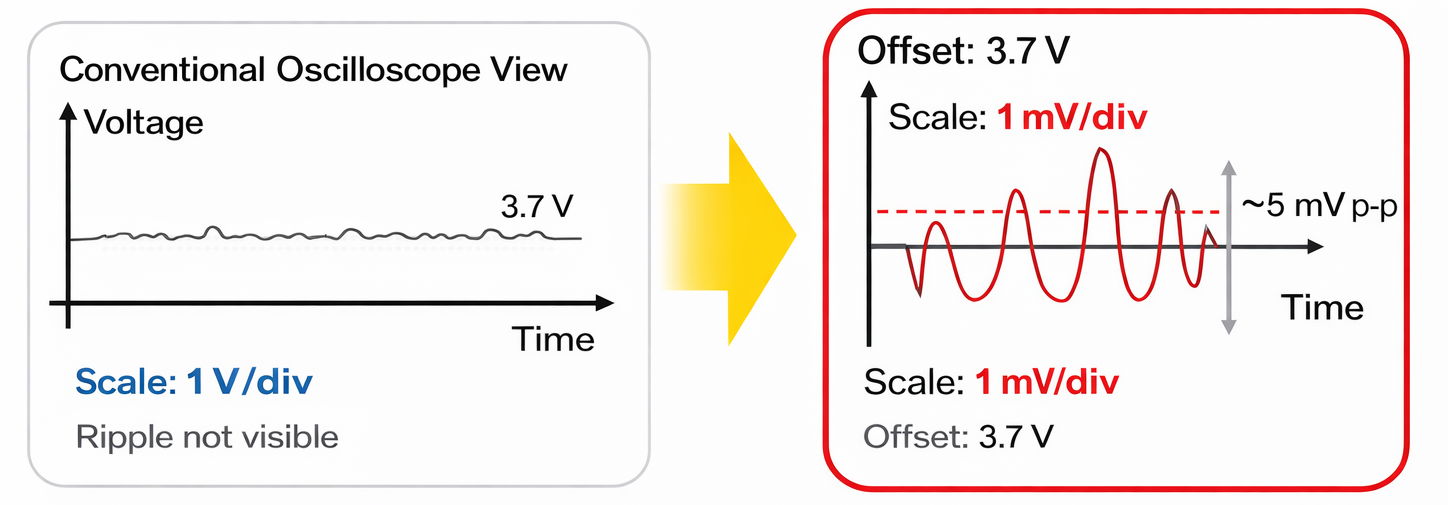
If an oscilloscope is set to display the full DC voltage, the ripple becomes nearly invisible. Conversely, if the vertical scale is reduced to observe ripple, the DC voltage drives the signal off screen.
To solve this problem, engineers commonly use AC coupling.
The Traditional Approach: AC Coupling
Most oscilloscopes provide an AC coupling mode that removes the DC component of the signal before it reaches the acquisition system.
This is accomplished by inserting a series capacitor in the signal path, which blocks DC and forms a high-pass filter with the oscilloscope input impedance.
When AC coupling is enabled:
- The DC voltage is removed
- The waveform is centered around 0 V
- The vertical scale can be reduced to observe small ripple
This is why AC coupling is widely used for ripple measurements on power rails and DC buses.
Typical AC-coupling filters in oscilloscopes have a cutoff frequency on the order of a few hertz to around 10 Hz, depending on the instrument design. (EDN)
While convenient, this technique introduces several measurement limitations.
Limitations of AC Coupling for Ripple Analysis
Because AC coupling is implemented as a high-pass filter, the displayed waveform is not the true ripple signal present on the bus.
Loss of Low-Frequency Ripple
Ripple on DC buses often includes important low-frequency components such as:
- Line-frequency ripple (50/60 Hz)
- Low-frequency load modulation
- Control-loop oscillations
- Converter interaction frequencies
A high-pass filter attenuates low-frequency signals, which means these components may be reduced or distorted.
In extreme cases, low-frequency ripple may disappear entirely from the measurement.
Amplitude Distortion
High-pass filters introduce frequency-dependent attenuation. Ripple components close to the cutoff frequency will appear smaller than they actually are.
For engineers validating ripple specifications or capacitor performance, this can lead to underestimating the true ripple magnitude.
Distortion of Transient Events
Slow events on the DC bus—such as load steps or bus droop—are distorted by the high-pass filter.
Common artifacts include:
- Baseline wander
- Apparent waveform droop
- Long settling times after step events
These artifacts can obscure the real behavior of the power system.
Loss of Absolute Bus Reference
AC coupling removes the DC level entirely. While this simplifies viewing ripple, it eliminates the ability to directly correlate ripple with the actual bus voltage operating point.
This can make it harder to analyze events such as:
- Bus voltage droop
- Dynamic load changes
- Startup behavior
Why Engineers Often Use AC Coupling Anyway
Despite these limitations, AC coupling remains widely used because many oscilloscopes cannot apply enough vertical offset to remove very large DC voltages.
On most instruments, the vertical position (offset) range is tied to the selected volts-per-division setting, which allows only a limited amount of DC shift. When measuring a bus that may be hundreds of volts, this offset range is typically insufficient to move the DC level off screen while still maintaining the small vertical scale needed to observe millivolt-level ripple.
This constraint often forces the oscilloscope to operate at a larger vertical scale than is ideal for ripple analysis, which reduces measurement resolution. When the vertical scale must accommodate the large DC component, the ripple occupies only a small portion of the oscilloscope’s available vertical range. As a result, the acquisition system does not fully utilize the available analog-to-digital converter (ADC) dynamic range. This effectively reduces the number of useful bits capturing the ripple signal and limits measurement fidelity.
Because of these constraints, engineers frequently rely on AC coupling simply because it provides a practical way to remove the large DC component and zoom in on the ripple waveform using conventional oscilloscope controls, even though doing so introduces the high-pass filtering limitations discussed earlier.
A Better Approach: DC-Coupled Measurements with DC Offset
An improved technique for ripple analysis is to keep the measurement fully DC-coupled and apply a DC offset adjustment large enough to cancel the bus voltage.
In this method:
- The oscilloscope remains DC-coupled
- A DC offset equal to the bus voltage is applied
- The ripple waveform is displayed around the offset level
The key advantage is that no filtering occurs. The oscilloscope acquires the real signal present on the bus.
This allows engineers to zoom into millivolt-level ripple while preserving the entire frequency spectrum.
Benefits of the DC Offset Technique
Preserves True Ripple Magnitude
Since no high-pass filtering is applied, ripple amplitude is displayed exactly as it exists on the bus.
Retains Low-Frequency Information
DC offset measurements capture all frequency components, including:
- Line-frequency ripple
- Control loop oscillations
- Converter interaction frequencies
These components are often critical when diagnosing stability problems.
Accurate Transient Analysis
Because the signal path remains DC-coupled, slow transient behavior remains intact. Engineers can observe:
- Bus droop during load steps
- Recovery dynamics
- Long time constant behavior
More Complete System Insight
By observing the true ripple waveform, engineers gain better visibility into system interactions such as:
- Switching harmonics
- Filter resonances
- Beat frequencies between converters
This deeper insight often accelerates debugging and root-cause analysis.

Where Yokogawa Comes In

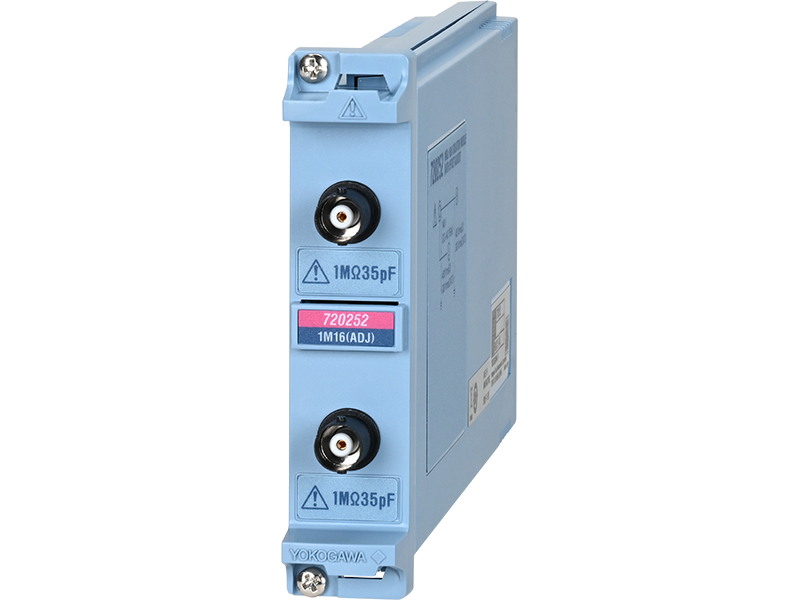
Recognizing the limitations engineers face when analyzing ripple on high-voltage DC buses, Yokogawa Test & Measurement has introduced a new measurement solution designed specifically for this challenge. The 720252 input module for the ScopeCorder platform enables true DC offset nullification, allowing engineers to accurately observe small ripple signals riding on large DC voltages without relying on AC coupling.
The 720252 combines 16-bit vertical resolution with very high sensitivity, down to 1 mV/div, allowing extremely small voltage variations to be captured even in the presence of large DC bus levels. By applying a large DC offset while maintaining DC coupling, the module allows the DC component of the bus voltage to be effectively nulled while preserving the full ripple waveform. This avoids the high-pass filtering artifacts introduced by traditional AC-coupled measurements.
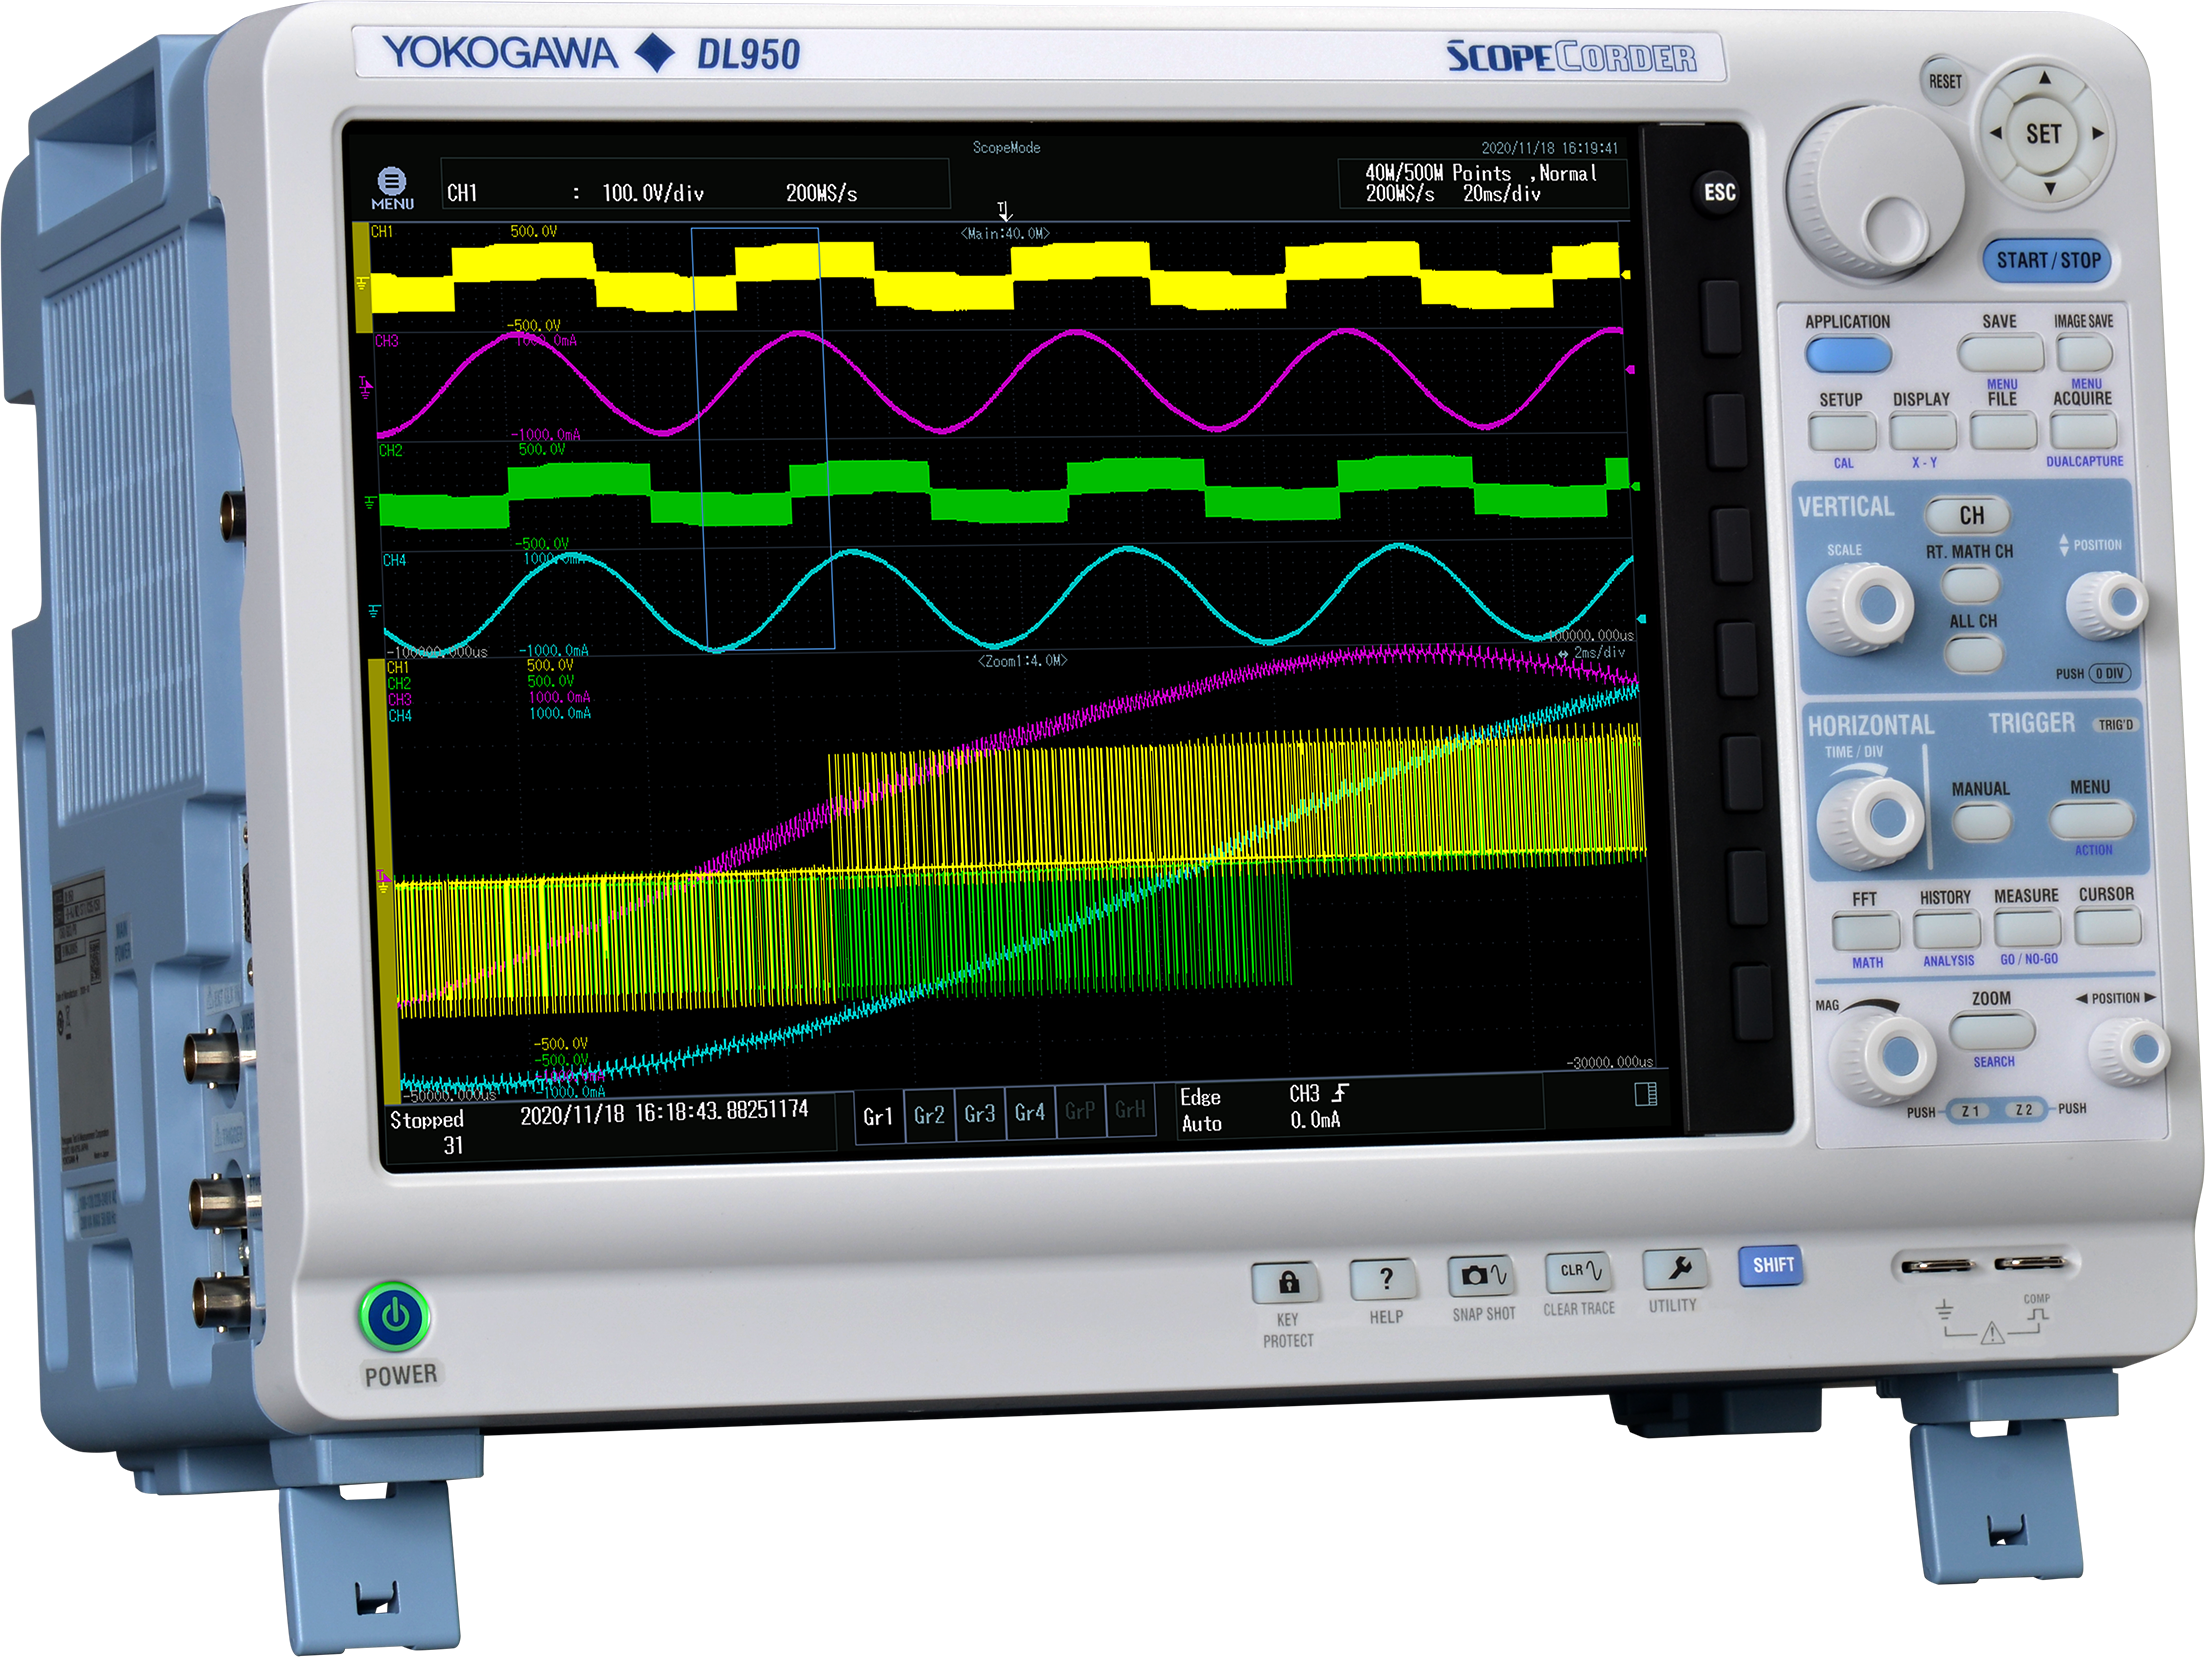
In addition to its offset capability, the module benefits from the broader capabilities of the ScopeCorder platform. The module features isolated inputs, which simplifies measurements on floating or high-voltage DC buses. This isolation allows engineers to probe many bus structures using passive probes connected directly to the module, eliminating the need for bulky or expensive differential probes in many situations.
The ScopeCorder platform also enables multi-channel synchronized acquisition, allowing engineers to capture ripple simultaneously across multiple nodes in a power system. This is particularly valuable when analyzing interactions between converters, control signals, and bus dynamics. In combination with the ScopeCorder’s real-time processing architecture, users can perform live math, spectral analysis, and power calculations directly on the A/D data, with results available for triggering or long-duration recording.
Together, these capabilities provide a measurement approach that is uniquely suited to modern power electronics development. By combining high dynamic range, DC offset capability, input isolation, and real-time analysis, the 720252 module enables deeper and more efficient analysis of ripple and system dynamics on high-voltage DC buses.
Example Measurement Scenario
Consider a 400 V DC bus feeding a motor inverter with the following characteristics:
- 20 kHz switching ripple from the inverter stage
- 100 Hz modulation related to the inverter fundamental frequency
- Control loop dynamics occurring below 10 Hz
- A ripple amplitude of approximately 7 mV
These ripple components span a wide frequency range and contain important information about both switching behavior and system stability.
If AC coupling is used to view this ripple:
- The 100 Hz modulation component may be attenuated depending on the high-pass filter characteristics
- Sub-10 Hz control loop dynamics may be significantly distorted or completely removed
- The measured ripple amplitude may appear smaller than its true value due to filter attenuation
While this approach makes the ripple easier to visualize, it also removes important information about the system.
Using the 720252 module with DC offset nullification, the ScopeCorder can instead maintain a fully DC-coupled measurement while removing the large DC component from the display.
In this configuration, the instrument can:
- Preserve the true ripple magnitude, enabling accurate amplitude measurements and calculations
- Apply an offset to remove the 400 V DC level, allowing the small ripple signal to be displayed at high sensitivity
- Zoom into the ripple waveform with millivolt-level scaling, such as a 10 mV viewing window, to fully utilize the 16-bit dynamic range
- Capture slow variations or transients if the ripple magnitude changes over time or across multiple operating cycles
Because the signal remains DC-coupled, all frequency components remain intact. This allows engineers to observe switching ripple, low-frequency modulation, and slow control loop dynamics simultaneously.
The result is a complete and accurate representation of the DC bus ripple, enabling more reliable analysis of system behavior and faster identification of performance or stability issues.
Conclusion
Ripple analysis on DC buses is an essential diagnostic technique in power electronics systems. While AC coupling has traditionally been used to remove the large DC component of bus voltages, it does so by inserting a high-pass filter that alters the waveform being measured.
This filtering can hide low-frequency ripple, distort amplitude measurements, and obscure important system dynamics.
Maintaining a DC-coupled measurement with a large DC offset adjustment allows engineers to observe ripple exactly as it exists on the bus. By preserving signal magnitude, retaining low-frequency information, and avoiding filter-induced artifacts, this technique provides a more accurate and insightful view of power system behavior.
As oscilloscopes and measurement techniques evolve to support larger offset ranges, DC offset–based ripple analysis offers a superior alternative to traditional AC-coupled measurements.
Related Products & Solutions

1 MS/s 16-Bit Isolation Module (with Offset adjust)
1 MS/s 16-Bit Isolation Module (Offset Adjust)
- 2-Channel Analog Input
- 1 MS/sec, 16-Bit
- 300 kHz Bandwidth
- Max. Input Voltage (DC + ACpeak): 600V / 140V
- High Sensitivity Range (1 mV/div), Low Noise (±100 µVtyp)
- Offset Adjustment

Isolated Oscilloscopes | ScopeCorders
- An integrated measurement system for every electromechanical application
- Modular platform combines oscilloscope and DAQ functionality
- Capture high-speed transients and low-speed trends