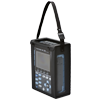
CW500 Power Quality Analyzer

The Yokogawa CW500 is a portable power meter that utilizes current clamp-on probes, easy to use navigation screens and bluetooth and SD cards for communication and data logging. These features enable user-friendly power consumption and power quality measurements in the field that conform to IEC61000-4-30 Class S. This standard dictates that two measuring instruments of similar rating must measure within some percentage of each other when exposed to the same signal.

Utilities and substations contain large arrays of transformers, generators and electrical distribution networks. To maintain the health and safety of such infrastucture, a reliable power quality analyzer is needed. This power quality analyzer should be capable of not only logging single to multi-phase power, but also trend and monitor anomalies in the power system such as voltage sags,swells and dips, as well as flicker, inrush current, and demand changes. The CW500 power quality monitor is perfectly suited for this task due to its:
Varied Functionality
- Log anything from single phase two wire to three phase four wire systems, and everything in between
- Capture irregularities in your power system such as voltage sags,dips, swells and log them conviently to RAM or an SD card
- Log upto 50th orders of harmonics
- Vector display for convenient tracking of voltage/current phase relationships
Portability
- Small form factor and battery inputs allow the user to take this unit anywhere, anytime
- Use the free CW500 viewer to connect remotely to the unit to log data or view events in real-time
Ease of use
- Quickly and easily shift between setting up the unit or viewing logged variables and waveforms
- Supports USB and bluetooth
- Set a predetermined record length or schedule or a start time and duration for logging data
Key Features
- Power Measurement and Logging
- Power Quality Measurement
- User Support
- Analysis of Data and Report Generation
Power Measuring and Logging
- Simultaneously measures 3 CH Voltage input, 4 CH current clamp probe input, 2 CH DCV input.
- Instantaneous/Average/Maximum/Minimum value list or trend graph screen of Voltage/ Current/Power/Power factor/Phase Angle/Phase Advanced Capacitance Calculation.
- Integration Value of Active/ Reactive/Apparent Energy is each displayed consumption and generation.
- Demand monitoring which displays screens of present power consumption compared to aimed demand power values.

User Support
Quick Start Guide Function:
- The Quick Start Guide Function supports correct wiring and setting before measuring.
- The Quick Start Guide Function automatically recognizes the type of current clamp probe.
Vector Display:
- The Vector Display indicates Voltage and Current phase difference and values between input channels of voltage and current.
- The Vector Display checks whether the wiring is correct or not.
Power Quality Measuring
Measure Temporary Malfunctions of the Power Line
- The CW500 captures temporary malfunction phenomena of the power line that can cause malfunction or destruction of devices due to voltage swell, voltage dip, interruption, transient voltage over, and inrush current by using a high sampling rate of 24 µs and RUS calculation.
- Event data contains the type of malfunction, occurred time or occurrence finish time, measured value and waveform of voltage and current of all channels for approx. 200 ms period.
- This measurement method conforms to IEC standard 61000- 4-30 Class S
Measure Continuous Malfunction of the Power Line
Harmonics
- Measure and display graphs and lists of up to the 50th Harmonic components of voltage, current, and power for each phase and total.
Flicker
- Measures 1-minute flicker (Pst, 1 min), short flicker, (Pst) and long flicker (Plt).
Unbalance rate
- Displays voltage and current unbalance rate on 3 phase wiring.
CW500Viewer (Included PC software)
- Automatically display the graphical and report data by clicking on the file on the PC display.
- Manage multiple settings of the unit.
- Measure in real-time using USB communication.
Types of data
- Integrated power data, power quality event data, main unit setting data, and screen capture data.
Memory card and interface
- SD memory card, USB communication, Bluetooth communication (available for US, Canada and Japan only).
Power Measuring
Power line and Input Channel: 3 CH Voltage, 4 CH for Current Clamp Probe.
1P2W (up to 4 systems), 1P3W (up to 2 systems), 3P3W2current (up to 2 systems), 3P3W3current, 3P4W
Power measuring item:
Instantaneous, average, maximum, and minimum values for each setting period:
Voltage/Current/Power (Active, Reactive, Apparent)/Power Factor/ Phase Angle/Frequency/Calculated Phase Shift Capacitance/DC voltage value 2 CH.
Integration Value
Energy (active, reactive, apparent), Demand (list or graph display of change in a specific period and as a whole)
Recording Interval Period
1/2/5/10/15/20/30 second, 1/2/5/10/15/20/30 minute, 1 hour/2 hours
Recording method
Manual, time, period
Estimated Recording Length with 2 GB SD card

- The recording length shortens according to the number of power quality events.
- Only the included SD memory card or dedicated SD memory card is guaranteed.
Various Measuring Screen
List display, zoom display by 4 or 8 divisions, trend graph display, integration value display for energy, demand list display of value, demand graph display for change of period, demand graph display for whole recording
List Display
Hems of measuring values can be selected with position.

Zoom Display
Zoom display can be selected by 4 or 8 divisions.

Trend Graph
Trend graph of voltage/ current/power/power factor/frequency/ advanced phase condenser external DC voltage.

Energy Display
List of active, apparent, reactive by consumption or generation.

Demand measuring
Demand is the average power value of a specific period (usually 30 minutes). The contract with the power supplier conditionally concerns the maximum average power value between a period for the consumption fee. This function supports how to maintain within the target consumption by monitoring the estimated demand value to the setting rate with the maximum demand value.
List of Demand Value

Graph display of change on specific period

Graph display of whole demand trend

Analysis and Reporting of recorded data
Trend analysis graph

Sample of report

Power Quality Function
Short period power line malfunctions such as voltage swells, dips, interruptions, transients, over or inrush currents, or long periods of harmonic distortion/flicker may damage or reset your devices.
The CW500 helps to identify each of those short period malfunctions by recording occurrence time, occurrence finish time and waveforms. Additionally there is a digital output on occurrence.
Long period malfunctions can be analyzed by harmonics, flicker, waveform, or by checking on the unbalance rate calculation for a 3 phase measurement.
All data can be finalized into a report format with the included software. The CW500 conforms to the IEC standard of 61000-4-30 Class S.

User Support Function
User Friendly
Quick start guide and automatic type of clamp recognition
The quick start guide will show on-start measuring and how to wire and set the range before measuring. The automatic clamp detection will insure the settings are correct.
Start of guidance
PUSH the “START/STOP” key.
Select “Quick start guide”.
Select recording item.

Wiring
Select the wiring and the appropriate connection diagram will be displayed.
Connect accordingly.

Wiring check/self diag./self id.
Wiring check, self-check and the type of clamp is automatically detected and the results displayed.
If NG is displayed, the detail can be confirmed by pressing the “ENTER” key.

Recording setting
Set the recording interval time and the recording time or period.

Power supply from measuring line
Power (under 240 VAC) can be supplied by using the power supply adapter (sold separately).

Note: This is not available for EV region.
Leakage current measuring
The external magnetic field effect is 0.002 A or less, at 400 A/.
Yokogawa’s proprietary technology has achieved a magnetic field impact amount of 30 ppm even in adjacent power lines (at 100 A).
Below is an example of how to measure a neutral line of 3 phase 4 line.

Multiple line measuring
4 system load measuring
Maximum of 4 systems is capable for 1 phase 2 line Maximum of 2 systems is capable for 1 phase 3 line or 3 phase 3 line.
Software for Analysis and Setting (Free) CW500Viewer
Data analysis, data reporting, making a setting file and doing a real time measurement can be easily done with the CW500Viewer.
The data can be transferred by SD memory card, USB communication or Bluetooth communication (for USA, Canada, Japan only).
The graph and lists are created by a click on the data file.
- The graph and lists of the recorded data file are created by clicking on the desired data file. They can be displayed and copied on a clipboard so it can be used on other software such as Word or Excel.
- The time axis and measure axis can be zoomed in or out easily. With this capability, micro and macro changes can be displayed.
- Waveforms of power quality events (Voltage swell, voltage dips, voltage interrupt, voltage transient, (over and inrush current) which are recorded by 200 ms period can be displayed and printed.
- The integrated data can be added on one graph, enabling the whole energy integration data to be displayed.
- Integrated energy data can be scaled into CO2 or the crude oil value.

Settings management
- Setting data can be read out from and to the main unit via SD memory card, USB communication cable or Bluetooth communication (*1).
- Setting data can be easily edited, saved and managed.
Real time measurement
- Real time measurement can be performed on up to 2 units simultaneously via USB communication or Bluetooth communication (*1)
System Requirements


Power Measuring + Power Quality Examination
Examination of main power line quality for factory system control and assets
- Confirm the quality of power lines for factory system control and assets.
- Simultaneously measure the consumption of energy trend and consider solutions for energy saving.
The CW500 not only continuously measures harmonics but it also captures malfunctions of the power line and records the occurrence time with waveforms. Simultaneously, it can measure the power and leakage current of a neutral phase. Additionally, users can confirm the condition of assets when signals are connected to the DCV input channels.

Power Line Measuring Examination
Checking Energy Efficiency of LED lighting
Verify the energy saving effects of LED lighting compared to standard incandescent lighting by performing before and after measurements.

Checking power consumption of driving pumps of a manufacturing line
Inverters were installed on many driving pumps in liquid manufacturing lines, and power consumption measurements are needed to check the before and after effects.
Multiple parameters can be set and measured by the PC software. Additionally, the power line quality can also be tested to assure the new inverters can be operated safely.
Improving power line quality of a printing factory by measuring harmonics (Printing factory)
Purpose: Investigation of the cause of constant malfunctions for printing machines.
Harmonics distortion on line could be the reason?
Measuring: CW500 key features
- Compact and easy to carry.
- Measures harmonics up to 50.
- Long term recording
Result: Confirming high level harmonic contents on 5th and 7th.
Many damaging harmonics are discovered in the 5th and 7th harmonics. 5th harmonic content can damage the calculation of capacitance for improving power factor.


Improving the power factor for power efficiency
The CW500 can calculate the appropriate capacitance value by setting the aimed power factor value.
By setting the proper capacitance calculation and improving the power factor, users will benefit from power savings with less load current and improve the capacity of the whole power system.


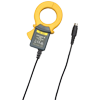


96065 Clamp-on probe
- 96065 Current clamp-on probe
- max. approx. 110 mm
- AC 1000 A flexible type load current measurement

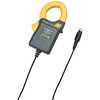
96066 Clamp-on probe
- 96066 Clamp-on probe
- max. approx. 150 mm
- AC 3000 A, 3 CH Load current measurement


In the Chancellor’s Honors Program Projects research paper published on Tennessee Research and Creative Exchange (TRACE), researchers from the University of Tennessee Knoxville, with the Electric Power Research Institute (EPRI) and the Manufacturing Demonstration Facility (MDF), use a Yokogawa Test&Measurement Clamp-On Power Meter to easily capture three-phase power data.

In research published by Yale University's Journal of Industrial Ecology (now owned and managed by the International Society of Industrial Ecology), researchers from the University of Nottingham and Dartmouth University use a Yokogawa Test&Measurement CW240 Clamp-On Power Analyzer to measure the real power consumption of the investigated printing systems.
Brochures
- CW500 Power Quality Analyzer (3.7 MB)
Instruction Manuals
- CW500 Power Quality Analyzer User's Manual (6.0 MB)
- CW500 Power Quality Analyzer Getting Started (3.5 MB)
- CW500Viewer User's Manual (4.3 MB)
- CW500Viewer Install Manual (274.6 KB)
- CW500 Power Quality Analyzer Firmware Update Procedure (339.9 KB)
Software
Firmware
Drawings
- CW500 Power Quality Analyzer (342.1 KB)
Product Overviews

Webinars
- A look at multi-phase measurements and measurement techniques
- A review of practical applications
- Real-world examples

Although DC power measurements can be fairly straightforward, complexities with AC power measurements arise when dealing with distorted waveforms, fluctuating power factors, and multiple phases, which introduce intricacies that complicate an otherwise simple measurement process.
This on-demand webinar provides an informative dive into the various fundamental aspects of power measurement and includes:
