OTDR Testing Fundamentals
Basics of Optical Time Domain Reflectometry and Key Considerations for PON Measurement
An Optical Time Domain Reflectometer (OTDR) injects optical pulses into a fiber and analyzes the returning backscatter and reflected light. From a single end of the link, it can determine the magnitude and location of loss, detect reflections, and visualize events along the fiber. This tutorial summarizes core OTDR principles, explains how OTDR differs from the light source + optical power meter method, outlines the main causes of fiber loss, describes key OTDR specifications, and introduces the fundamentals of PON measurement.
1. Introduction
In fiber optic network installation, maintenance, and troubleshooting, it is not enough to know only the total loss of a link. Engineers also need to identify where loss occurs and what type of event is causing it. Because an OTDR can visualize connectors, bends, reflective points, and fiber breaks as a trace, it is widely used for installation verification, preventive maintenance, and fault location.
2. What Is an OTDR?
An OTDR (Optical Time Domain Reflectometer) launches short optical pulses into a fiber and analyzes the Rayleigh backscattered light and Fresnel-reflected light generated within the fiber. The instrument calculates distance from the light round-trip time and estimates loss and reflection from the amplitude of the returned signal.
A major advantage of OTDR testing is that the condition of the entire fiber link can be assessed from one end only. This makes the method especially effective for long-haul links and field maintenance work.
3. Basic Operating Principle
OTDR measurement is based on the relationship between propagation time and distance. Because light travels through optical fiber at a known speed determined by the refractive index, the position of an event can be calculated from the elapsed time between pulse launch and signal return.
The OTDR relies mainly on two kinds of returned light. Rayleigh backscatter occurs continuously along the fiber and reveals distributed attenuation. Fresnel reflection occurs at discontinuities such as connectors and fiber breaks and indicates reflective events.
4. Comparison with the Light Source + OPM Method
Two representative methods are used to measure optical fiber loss: the light source + optical power meter (OPM) method and the OTDR method. The two approaches serve different purposes and each has its own strengths.
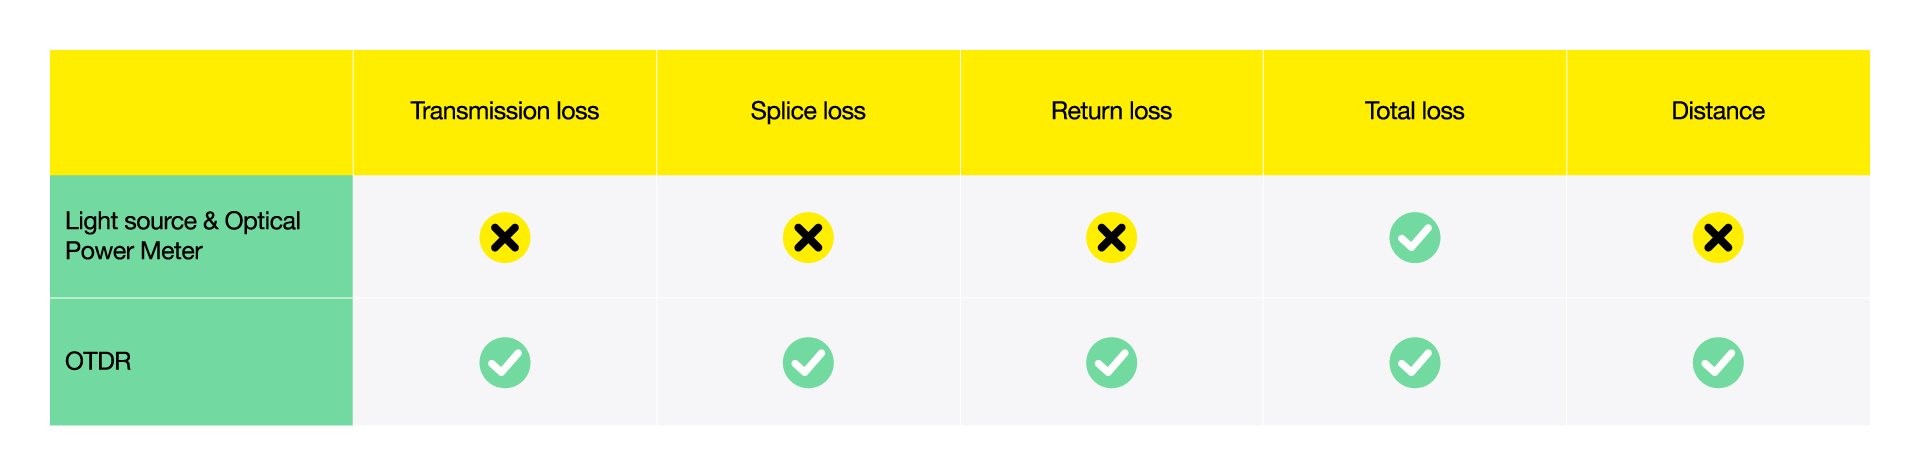
The light source + OPM method uses a stable LD or LED source at one end and measures optical power at the far end. It is well suited to verifying the total insertion loss of an end-to-end link. However, it cannot identify where loss is occurring within the link.
By contrast, an OTDR can measure distributed attenuation, event loss, return loss, and total loss from one end of the fiber, while also providing the distance to each event. For this reason, OTDR is highly effective not only for post-installation evaluation, but also for fault isolation and maintenance.
5. How to Read an OTDR Trace
In an OTDR trace, the horizontal axis represents distance and the vertical axis represents the returned optical level. A gradual downward slope indicates transmission loss along the fiber. A sudden step indicates event loss caused by a splice, connector, or bend. A sharp peak indicates a reflective event.
When a large reflection is followed by an abrupt drop to the noise floor, the event is likely to be the end of the fiber or a break.
6. Main Measurement Items
- Attenuation: the continuous loss along a fiber section, typically expressed in dB/km.
- Event loss: localized loss caused by fusion splices, mechanical splices, connectors, or bends.
- Reflection / return loss: the amount of reflected light generated at connection interfaces or end faces.
- Distance: the position of each event from the OTDR launch point.
- Total loss: the overall loss of the measured fiber section.
7. Causes of Optical Fiber Loss
Optical loss in fiber is caused by several physical mechanisms and installation-related factors. The basic loss components are outlined below.
- Rayleigh scattering loss: loss caused by microscopic density fluctuations inside the glass. In OTDR measurement, part of this scattered light returns toward the instrument and is used as the backscatter signal.
- Macrobend loss: loss that occurs when the fiber is bent with a relatively large curvature, allowing part of the guided light to escape from the core region.
- Fusion splice loss: loss generated at a splice point due to core misalignment, a gap between fibers, contamination, or other imperfections at the joint.
- Coupling loss: loss caused by poor coupling conditions between the connector, the receiving side, or interconnected components.
- Break loss and Fresnel reflection: at a boundary where refractive indices differ, part of the light is reflected. This reflected light is observed by the OTDR and often appears prominently at open ends or break points.

8. Key OTDR Specifications
8.1 Dynamic Range
Dynamic range indicates how much total loss an OTDR can measure. A larger dynamic range enables measurement over higher-loss links, which in practice means longer fiber distances. In general, increasing the pulse width improves dynamic range.

8.2 Event Dead Zone
The event dead zone is the minimum distance required to distinguish two consecutive reflective events as separate events. If reflective connectors are located close together and the event dead zone is too large, they may not be resolved individually. In general, the event dead zone becomes larger as pulse width increases.

8.3 Attenuation Dead Zone
The attenuation dead zone is the minimum distance required after a Fresnel reflection before the OTDR can accurately measure fiber attenuation again. This value also increases as pulse width becomes longer.

8.4 Relationship with Pulse Width
Long pulse width: provides higher optical energy and is advantageous for long-distance measurement. At the same time, it broadens the dead zones and makes it more difficult to separate closely spaced events.
Short pulse width: provides better event resolution and is advantageous for short-distance testing and detailed event analysis. However, the measurable distance becomes shorter and trace noise tends to increase.
Accordingly, test conditions should be selected based on whether short-distance, high-resolution measurement or long-distance, high-dynamic-range measurement is the priority. As a general trend, increasing pulse width improves dynamic range while increasing both event dead zone and attenuation dead zone.
9. OTDR Behavior in PON Networks
9.0 What Is PON?
PON (Passive Optical Network) is a network architecture in which a single optical fiber is split and shared among multiple subscribers. An optical splitter placed between the central office and subscriber premises distributes one optical signal to multiple user branches. Because the distribution network is composed of passive devices that require no electrical power, the system is referred to as “passive.”
PON is widely used in access networks such as FTTH. However, the presence of optical splitters makes OTDR measurement more challenging than in ordinary point-to-point links.

9.1 Measurement from the Central Office Side (Downstream)
When measurement is performed from the central office toward the subscriber side, a large loss appears at the optical splitter position. Typical splitter loss is approximately 6 to 9 dB for 1:4 branching, 9 to 12 dB for 1:8 branching, and 12 to 15 dB for 1:16 branching.
Reflections are generated at subscriber-side ONU terminations, but reflections from all branches do not necessarily appear as clear end events. In many cases, only the farthest branch is recognized distinctly as the terminal event, while other reflections may appear similar to intermediate events.
9.2 Measurement from the Subscriber Side (Upstream)
When measurement is performed from the subscriber side toward the central office, a large loss also appears at the splitter position. The far-end terminal is the central-office OLT, and branches to other subscribers are not displayed as visible side branches in the trace.
In other words, trace appearance changes depending on the direction of measurement. The waveform must therefore be interpreted with a clear understanding of which side of the PON is being tested.

9.3 Considerations for Fault Isolation in PON
No1, If only one ONU is out of service, the fault is likely located between the subscriber premises and the second splitter. If other subscribers remain in service, the section from the subscriber side to the second splitter can be evaluated by OTDR.
No2, If some subscribers under the same second splitter are out of service, the fault may be located between the second splitter and the first splitter. In that case, testing from the subscriber side is useful for isolation.
No3, If all subscribers are out of service, the fault is more likely located between the first splitter and the central office. From the subscriber side, the test must pass through two splitters, which often requires a longer pulse width and reduces detail in the waveform. If service interruption is permissible, measurement from the central office side with a shorter pulse width generally provides better diagnostic detail.
10. Practical Points
OTDR is the right tool when the objective is to determine where loss and reflection occur. If only total loss verification is needed, the light source + OPM method is also effective.
Contaminated connector end faces are a major cause of measurement error and service problems, so connector inspection and cleaning before testing are essential.
For long links, prioritize dynamic range. For closely spaced event analysis, prioritize dead-zone performance and choose pulse width accordingly.
In PON networks, splitter loss is large and trace interpretation changes with measurement direction and split ratio. Test conditions should therefore be set with a clear understanding of the network configuration.
11. Conclusion
OTDR is a powerful instrument that can identify fiber loss, reflection, and event location from one end of the link. By understanding the difference between OTDR and the light source + OPM method, the causes of optical fiber loss, and the meaning of major OTDR specifications, engineers can choose more appropriate measurement conditions and interpret traces more accurately.
In PON networks in particular, successful testing depends on recognizing the large losses introduced by splitters and the added complexity of the waveform. Measurement direction, pulse width, and the expected fault domain should all be considered carefully in field operation.
相关行业
相关产品和解决方案

AQ1210系列 光时域反射仪
横河作为一家拥有100多年历史的仪器制造商,依托在全球的光测试领域中积累了30多年的经验,现在推出了功能强大的新款光时域反射仪—AQ1210系列。
针对光纤网络安装和维护中操作人员日益需要更加可靠、易用的现场仪表,横河AQ1210系列OTDR旨在为用户提供快速精准的测量。
随着移动设备和互联网的广泛使用,光纤网络对高增长通信流量的适应性变得日益重要。
安装和维护光纤网络所用的测量仪器要求操作高效、界面直观,能提供高质量的测量结果和出色的可靠性。

AQ3550 Optical Switch Box
- 12-channel switch
- Control directly from an OTDR
- Convenient testing multiple ribbon fibers MPO/MTP

AQ7290 High-End OTDR
- 6 models in AQ7290 series
- Up to 47 dB dynamic range
- Wavelengths: 1310 / 1550 / 1625 / 1650 nm


掌上型光时域反射仪 AQ1000
AQ1000的推出,填补了OTDR便携机型产品线的空白。新机型特别有助于运营商工作人员在光纤接入网络(如FTTH)“最后一公里”的现场安装调试工作。虽然AQ1000定位为性价比超高的入门机型,然而AQ1000仍无愧于横河产品一贯的高质量、高精度和高可靠性,它还具备诸多常见于高端机型的优异性能——例如高品质多点触摸电容屏和无线连接功能。


获得更多专业服务