AQ6370E 通信波段 600-1700 nm


主要特点
- 波长范围:600至1700 nm
- 波长精度:±0.008 nm(典型值)
- 波长分辨率:0.02 nm
- 近端动态范围:78 dB(典型值)
- 功率测量范围:+20至-90 dBm
- 高速测量:新增效率提升2倍的SMSR快速识别模式
- 更锐利的光谱测量:HCDR 模式
- 大尺寸LCD触摸屏
超高动态范围:78 dB(典型值)
通过减少单色仪内的杂散光,AQ6370E 实现了78 dB 典型值的超高动态范围。

更锐利的光谱测量:HCDR 模式
HCDR(高迫近动态范围)模式专为单纵模激光器测量设计,使峰值附近的光谱更锐利,边模更清晰。
*注:仅高性能型号(-20)支持此模式。

Example of HCDR mode
Resolution setting 0.02 nm, High performance model
杂散光抑制比:80 dB(典型值)

Sensitivity setting: MID
High dynamic mode: OFF, typical
宽功率测量范围:+20 dBm至-90 dBm
AQ6370E 不仅可测量高功率信号源, 如光放大器、拉曼放大器和泵浦激光器,也可测量极弱的光信号, 甚至还能根据不同的测试应用和速度要求,从七种档位中选择测试灵敏度。
- 灵敏度提升:-85 dBm(1000至1300 nm);
- 平滑功能:减少测量光谱上的噪声;
- 高动态模式:当输入强光信号时,AQ6370E将通过降低杂散光影响的方式获得准确的动态范围。
自由空间光输入口
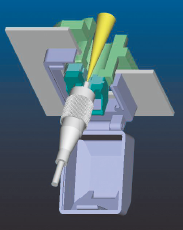 横河光谱仪兼容多模和单模光纤;
- 有效降低使用多模光纤时的插入损耗,有利于保持出色的测量效果;
- 由于测试口没有光纤的直接耦合,提升了每次插拔的重复性;
- 同时可以避免测试端面的污损和划伤,且兼容APC端面;
- 电平校正功能可解决由倾斜端面引起的功率偏差。
 横河光谱仪兼容多模和单模光纤;
更快的 SMSR 测量:SMSR 快速识别模式

SMSR 模式是专为快速测量激光器边模抑制比而设置的全新功能。
该模式的 SMSR 测量速度最高可达传统灵敏度模式(TRAD MIDx2)的两倍。
注意:根据被测信号功率不同,可能无法始终达到最高速度
丰富的远程控制接口(以太网、GP-IB)
宽范围扫描时依然保持超高分辨率,多达20,001个采样点使光谱仪在进行宽范围扫描的同时,仍能保持极高波长分辨率。
与传统系统相比,新款机型更加便捷高效。
宽范围扫描时依然保持超高分辨率
多达20,001个采样点使光谱仪在进行宽范围扫描的同时,仍能保持极高波长分辨率。与传统系统相比,新款机型更加便捷高效。
LCD大尺寸LCD触摸屏
分辨率高、响应灵敏的10.4英寸多点触控电容式触摸屏使设备操作更加简单直观。您可以像操作电脑平板设备一样更改测量条件、执行分析、更改光谱视图。
在光谱视图中,用户还能通过点击和拖拽波形,随意缩放和平移视图。

USB 端口
前后共 4 个 USB 端口,方便用户使用鼠标、键盘、外置硬盘、U盘等外部设备。

缩略图预览
通过缩略图,用户可快速从内部或外部存储的大量文件中找到所需文件。

一键保存测试曲线文件
支持将 7 条测试曲线一次性导出至一个 CSV 文件,方便用户通过 PC 应用程序进行后续分析,显著提升效率。
There are two models available, Standard and High Performance. The High Performance model provides even higher wavelength accuracy and dynamic range.
Specifications
| Items | Standard (-10) | High Resolution (-20) |
|---|---|---|
| Wavelength range | 350 to 1200 nm | |
| Wavelength resolution setting | 0.02, 0.05, 0.1, 0.2, 0.5, 1 and 2 nm | |
| Wavelength accuracy | ±0.02 nm (1450 to 1620 nm, ±0.015 nm typ.) ±0.10 nm (Full range) | ±0.01 nm (1520 to 1580 nm, ±0.008 nm typ.) ±0.02 nm (1450 to 1520 nm, 1580 to 1620 nm, ±0.015 nm typ.) ±0.10 nm (Full range) |
| Level sensitivity | −90 dBm (1300 to 1620 nm), −85 dBm (1000 to 1300 nm), −60 dBm (600 to 1000 nm) (Sensitivity: HIGH3) |
|
| Close-in dynamic range (0.02 nm resolution setting) | 55 dB (Peak ±0.2 nm) 37 dB (Peak ±0.1 nm) |
58 dB (Peak ±0.2 nm, 60 dB typ.) 45 dB (Peak ±0.1 nm, 50 dB typ.) |
| Stray-light suppression ratio (0.1 nm resolution setting) | 73 dB | 76 dB (Typ. 80 dB) |
| Sweep time (100 nm span) | NORM_AUTO: 0.2 s, NORMAL: 1 s, MID: 2 s, HIGH1: 5 s, HIGH2: 20 s, HIGH3: 75 s | |
Close-in Dynamic Range
| Standard (-10) | High Resolution (-20) | |
|---|---|---|
| Peak ± 1.0 nm | 73 dB | 73 dB (Typ. 78 dB) |
| Peak ± 0.4 nm | 62 dB | 64 dB (Typ. 70 dB) |
| Peak ± 0.2 nm | 45 dB | 50 dB (Typ. 55 dB) |
| *Resolution setting 0.05 nm | ||
DUT-oriented test apps (APP) simplifies the test process
Application (APP) mode transforms a versatile OSA into a machine dedicated to a device under test (DUT). APP mode provides a DUT-specific user interface that navigates the user from configuration settings to test result output without the user being aware of the wide variety of OSA settings.

The AQ6370E comes pre-installed with several basic applications such as WDM testing, DFB-LD testing, and FP-LD testing. In addition, the application can be downloaded from the Yokogawa website and added to the AQ6370E for use.

APP menu window
Gate sampling function
The Gate Sampling function facilitates the recirculating loop testing of optical transmission systems. Using an external gate signal, the AQ6370E obtains the optical spectrum of the signal which is passing through a certain loop. The advantage of this approach is its speed compared with the conventional External Trigger or Sweep Enable function.
Resolution calibration function
The Resolution Calibration function is used to calibrate the noise equivalent bandwidth with an external light source. With this new feature, the measurements of power density of a broad spectrum light source will be more accurate
Various Analysis Functions
7 Indvidual Traces
- Simultaneous multi-trace display
- Calculation between traces (subtraction between traces)
- Max/Min hold
15 Specific Data Analysis Functions
for popular applications, such as:
- Spectral width analysis
- WDM (OSNR) analysis
- WDM-NF (EDFA) analysis
- DFB-LD analysis
- FP-LD analysis
- iTLA analysis
- LED analysis
- SMSR analysis
- Various filter analysis
- With the macro programming, multiple analyses can be combined and executed automatically.
Building Automated Test System
Macro Programming

- Build a simple auto-measurement system without an external controller.
- Easy to create test program by recording the user's actual keystrokes and parameter selections.
Fast Remote Interfaces
- GP-IB and Ethernet (10/100Base-T) interfaces
- Improve the testing throughput of test systems by the fast measurement, command processing, and data transfer speed.
- SCPI compatible commands and AQ6317 Emulation Mode
- LabVIEW® Driver available
Easy to Keep Accurate
Ambient condition change, vibration and shock to an optical precision product, like an optical spectrum analyzer, will affect the optical components, and eventually degrade optical performance. Using standard functions, AQ6370E can maintain its high optical performance within a couple of minutes so that you can quickly start a measurement.
Built-in wavelength reference source
- AQ6370E comes equipped with a wavelength reference source for the wavelength calibration and optical alignment.
Wavelength calibration function
- Automatically calibrates with the built-in wavelength reference or an external light source, to ensure the wavelength accuracy.
Optical alignment function
- Automatically aligns the optical path in the monochromator using the built-in source to maintain high performance.
AQ6370E's overall high performance can cover not only manufacturing of optical devices and optical transmission systems but also research and development, and a variety of other applications.
- Optical active devices
- Laser diode/Fiber laser/Optical amplifier/Optical transceiver
- Optical passive devices
- Filter/FBG/AWG/WSS/ROADM/Optical fiber
- Optical transmission equipment (DWDM, CWDM)
- Development support of Applied photonics equipment
- LiDAR and 3D Sensing optical sources
LiDAR, Laser Diode Free-Space Beam Measurement

The free-space beam from device level optical sources for LiDAR, 3D sensing, Wafer Chips, optical transceiver TOSAs and laser diodes (LD) in general may be conveniently coupled to a fiber input using various beam capture solutions to optimize the spectral detection performance of the OSA.
For performing long-term testing of extreme temperature effects for automotive LiDAR devices as an example, learn how the Data Logging Function can be utilized to eliminate time-consuming program development and validation.
OSNR Measurement on DWDM System

AQ6370E's wide close-in dynamic range allows accurate OSNR measurement of DWDM transmission systems (up to 50 GHz spacing). The built-in WDM analysis function analyzes the measured waveform and shows peak wavelength, peak level and OSNR of WDM signals up to 1024 channels simultaneously.
Optical Amplifier (EDFA) Measurement

The ASE interpolation method is used to measure gain, NF, and key parameters for optical fiber amplifier evaluation. With WDM-NF analysis function, up to 1024 channels of multiplexed signals can simultaneously be tested. An ASE level for NF measurements is calculated by using a curve-fit function for each WDM channel.

AQ9447 Connector Adapter
- AQ9447 Connector Adapters
- For optical input port
- AQ6370 Series Optical Spectrum Analyzer Accessories


Numerical Aperture Conversion Fiber
By connecting a GI 50 or GI 62.5 optical fiber with a relatively large NA to the NA Conversion Fiber, the NA Conversion Fiber reduces the loss that occurs at the input and improves the measurement dynamic range during passive device measurements and the stability of optical level measurements during active device measurements.

Overview of optical communications via optical fibers including: signal conversion, optical fiber benefits, techniques like wavelength division multiplexing (WDM) for increased capacity, key components like optical amplifiers and spectrum analyzers for maintaining transmission quality.


This application note introduces free space light measurement jigs for measuring the emission spectrum of a light source that propagates in free space or the optical transmission spectrum of an optical filter. It describes four types of jigs for light sources and one type for filters.


Optical transceivers are one of the indispensable key devices for optical communications that interconvert optical and electrical signals.


To accurately measure pulsed light using an optical spectrum analyzer (OSA), it is necessary to understand the characteristics of the OSA and select the appropriate measurement method and settings.

Optimizing bias voltage is essential for efficient optical modulator operation, maintenance of signal quality, and meeting performance specifications required for a designated application. Proper biasing helps achieve desired modulation effects, reduces distortion, and enhances overall reliability of optical communication systems.

A plain-English guide to the parameters and architectures that define optical spectrum measurement, and how to choose the right instrument for your work.
宣传手册
- AQ6370 Series Optical Spectrum Analyzer (3.9 MB)
- Optical Spectrum Analyzer Selection Guide (1.1 MB)
- 光产品选型指南 (1.6 MB)
- 光谱分析仪AQ6370系列产品简介 (8.2 MB)
操作手册
- AQ6370E Optical Spectrum Analyzer User's Manual (15.8 MB)
- AQ6370E Optical Spectrum Analyzer Getting Start Guide (3.6 MB)
- AQ6370E Optical Spectrum Analyzer Remote Control User's Manual (3.0 MB)
软件
- AQ6370 OSA Viewer
- LabVIEW Drivers for AQ6370 series Optical Spectrum Analyzer ( NATIONAL INSTRUMENTS Web Page )
- MATLAB Toolkit for AQ6370 series Optical Spectrum Analyzer
- APP for Optical Spectrum Analyzer
- Sample Program for OSA
- Logging Data Utility
- OSA 通信助手
固件
图纸
- AQ6370E Optical Spectrum Analyzer (397.8 KB)
操作培训


产品展示


Introducing the new Yokogawa Test&Measurement AQ6380 Optical Spectrum Analyzer. This new OSA includes many sought-after features including:
• An unprecedented 5 pm wavelength resolution
• ±5 pm wavelength accuracy
• 1200 nm to 1650 nm wavelength range
• 65 dB wide close-in dynamic range
• 80 dB stray light suppression
• Automated wavelength calibration
• Gas purging
• DUT-oriented interface and test apps
• Backward-compatible remote interface
• 10.4in intuitive touchscreen
• Up to 20x faster measurement
• Remote operation capabilities
入门指南

Learn how to set up an Optical Spectrum Analyzer (OSA) for accurate measurements. This tutorial covers instrument transportation, installation, alignment, adjustment, and wavelength calibration. Discover best practices for preparing your Yokogawa OSA and improving optical testing accuracy.

Learn how to perform optical spectrum measurements using an Optical Spectrum Analyzer, from quick measurements with AUTO mode to advanced settings in MANUAL mode.

Learn how to compare optical spectra and save measurement data using an Optical Spectrum Analyzer.
网络研讨会


获得更多专业服务