Optical Spectrum Analyzer or Optical Wavelength Meter - Which is Best for Your Application?
Optical communications teams are being asked to develop higher-performance components and move them into volume production faster. As optical systems increase in channel count, bandwidth and integration, engineers need to verify the precise wavelengths of the optical signals and what is happening around those signals spectrally.
Two mainstay test and measurement tools for the optical engineer are the optical spectrum analyzer (OSA) and the optical wavelength meter. Both measure the properties of lasers, and both are used in R&D, design verification, and manufacturing. The distinction is in the question that each instrument is optimized to answer. An OSA answers the question “how is optical power distributed across wavelength?” by providing a detailed picture of the spectral content of an optical signal. The optical wavelength meter answers the question “what is the absolute wavelength of the dominant signal components?” with the very highest accuracy.
| Optical Spectrum Analyzer (OSA) | Optical Wavelength Meter | |
|---|---|---|
| Primary Function |
 Characterize the optical spectrum
|
 Precisely measure absolute wavelength(s)
|
| Underlying Technology | Typically a scanning monochromator with a diffraction grating | Interferometer, typically Michelson-based, with FFT processing |
| Primary Measurement | Optical power versus wavelength | Wavelength/frequency, optical power |
| Primary Strengths |
|
|
Table 1. OSAs and optical wavelength meters provide complementary capabilities.
Together, OSAs and wavelength meters provide a complementary suite of measurement and validation capabilities for optical engineers as they move their optical innovations through R&D, design verification, manufacturing, and deployment.
Optical Spectrum Analyzer: Spectral Characterization
The OSA measures how optical power is distributed across a specified wavelength range. The result is a trace of optical power versus wavelength that shows all the peaks and lower-level spectral features. Engineers use this view to evaluate spectral shape, center wavelength, linewidth, side modes, side-mode suppression ratio (SMSR), amplified spontaneous emission (ASE), optical signal-to-noise ratio (OSNR), channel power, crosstalk, and out-of-band emissions.
Most mainstream OSAs employ a scanning monochromator architecture. After the input light passes through an entrance slit, a collimating mirror directs the light to a diffraction grating, which separates the light according to wavelengths. A focusing mirror directs the wavelength spectrum to the exit slit and photodetector. By rotating the diffraction grating, different wavelengths pass through the exit slit to reach the photodetector, allowing the instrument to build the spectral trace.
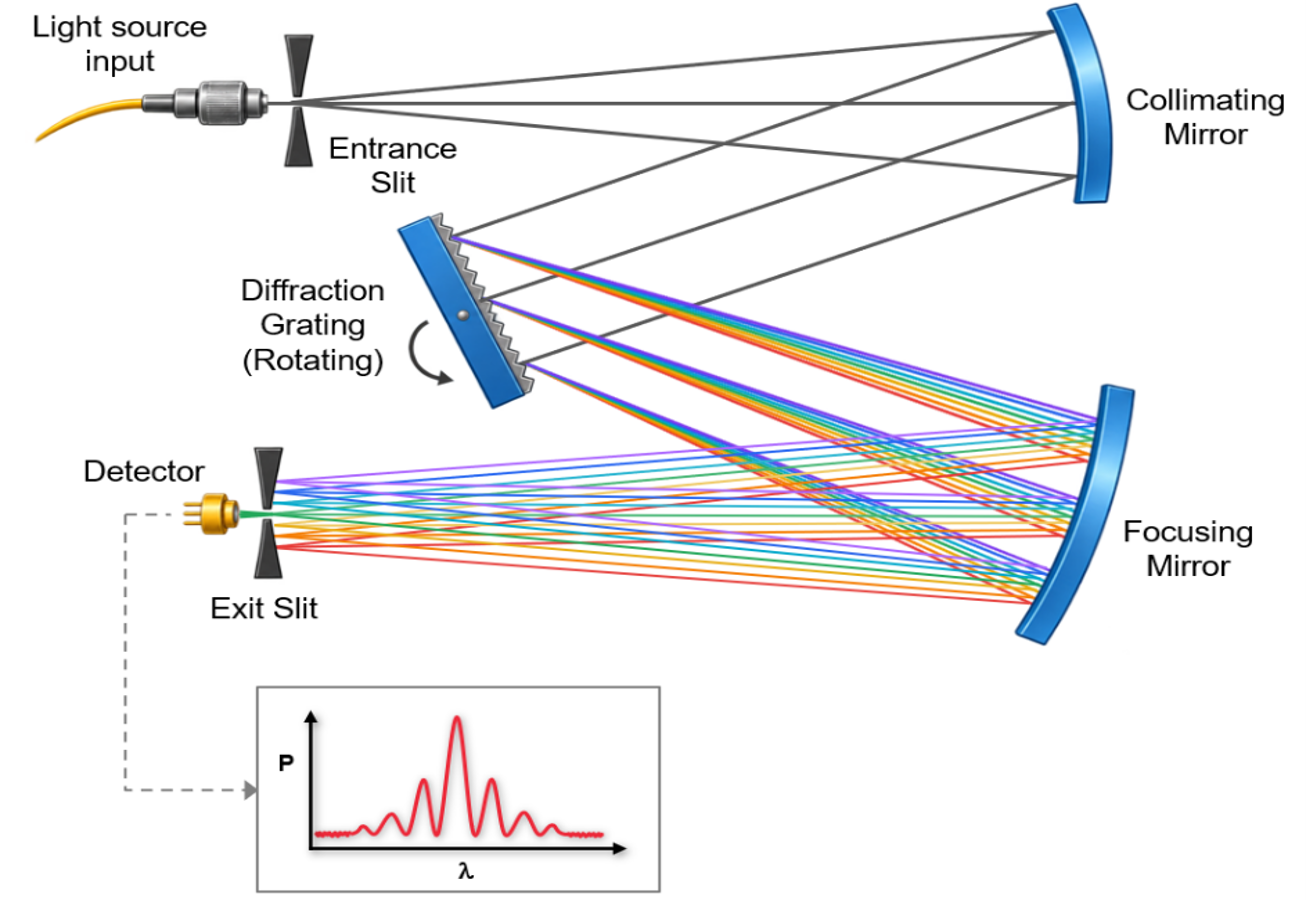
Figure 1. A scanning monochromator uses a rotating diffraction grating to record optical power versus wavelength.
Commercial OSAs are available for a wide range of wavelength spans and applications, with varying levels of wavelength resolution and accuracy. In general, monochromator-based OSAs deliver high performance, especially with regards to:
- Wavelength resolution and close-in dynamic range. High wavelength resolution helps distinguish closely spaced spectral features. Close-in dynamic range determines whether weak signals located near a strong carrier can be measured reliably.
- Sensitivity and stray light suppression ratio. These parameters determine the ability to measure side modes, ASE, and noise in laser measurements. The stray light sup-pression ratio also indicates the ability to detect weak signals in the presence of a strong carrier.
- Measurement versatility. An OSA can analyze narrowband lasers, modulated signals, broadband sources, filters, amplifiers, and WDM systems over a wide wavelength span.
The OSA is designed to scan and characterize a spectrum with a high level of detail. Key parameters when selecting an OSA include wavelength range, wavelength resolution and accuracy, close-in dynamic range, stray-light suppression ratio, and sensitivity.
Optical Wavelength Meter: The Most Accurate Wavelength Measurements
The optical wavelength meter is optimized to measure the absolute wavelength or frequency of a laser or other narrowband optical signal. Wavelength meters commonly use interferometric techniques, such as a Michelson interferometer. Incoming light is split into two paths, reflected by a fixed mirror and a movable mirror, and then recombined. As the optical path difference changes with the movable mirror, the detector records an interference signal, or interferogram.
A Fourier transform of the interference signal identifies the dominant optical frequency components. An internal metrology-grade reference light source is also routed through the interferometer to provide the optical path calibration needed for high accuracy.
The advantage of the wavelength meter is the precision with which it can directly locate the principal wavelength components with very high absolute accuracy. This is particularly valuable for laser adjustment and calibration, repeatability testing, WDM channel-grid verification, and high-throughput automated verification tests. While some wavelength meters are only able to measure one wavelength component, multi-wavelength instruments can identify many wavelengths in a single acquisition, subject to the instrument’s channel-separation limits.
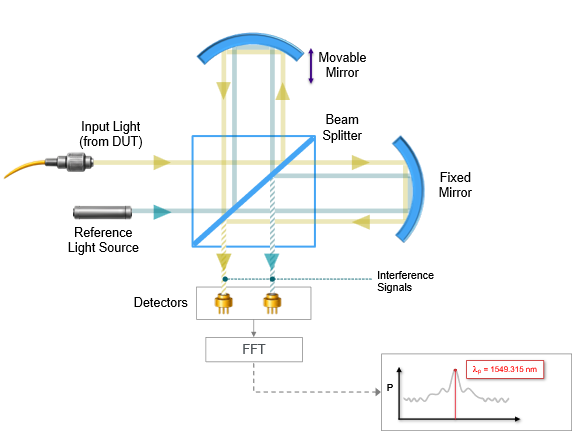
Figure 2. The optical wavelength meter uses a Michelson interferometer and Fourier analysis to accurately measure dominant wavelength components.
While the wavelength meter can provide some spectral content, it should be used for monitoring or debugging and not treated as a substitute for a full OSA trace. The relatively limited dynamic range and sensitivity of the wavelength meter yield spectral traces without the detail and information provided by OSAs. The strength of the wavelength meter is the precision and efficiency at which it can detect and measure the main wavelength components.
Example Application – Testing 400G LR4 Transceiver
The difference between an OSA and an optical wavelength meter can be illustrated by considering the measurement results for a 400G LR4 transceiver, which contains four PAM4 optical channels in the O-band.
Figure 3 shows the results of the signal scanned with both an OSA (Yokogawa AQ6361 OSA) and a wavelength meter (Yokogawa AQ6151B). While both instruments readily identify the four dominant carriers, the measurements displayed for each highlight the strengths of both instruments.
| Optical Spectrum Analyzer AQ6361 |
Optical Wavelength Meter AQ6151B |
|---|---|
|
|
|


Table 2. Comparison of measurement results for a four-channel LR4 transceiver.
The optical wavelength meter captures the absolute wavelengths of the four channels with an accuracy of ±0.2 ppm, or about ±0.26 pm at 1310 nm. While the wavelength meter includes a spectrum display, its relatively limited dynamic range means that the spectrum provides little more detail beyond the four dominant wavelength components.
The OSA, by comparison, measures power continuously over the full wavelength span with substantially higher sensitivity and dynamic range. In this example, the OSA reveals weak broadband emission approximately 60 dB or more below the LR4 carrier peaks, including structures consistent with spontaneous emission from the individual laser sources shaped by the transceiver's internal CWDM multiplexer. This detail is generally not available from a wavelength meter trace.
This comparison illustrates the complementary roles of these two instruments. The optical wavelength meter very precisely measures the location of each of the four LR4 channels, while the OSA reveals the side modes around each channel as well as the details of low-level noise occurring between the channels.
Choosing a Solution for Production Test
It is tempting to position the OSA as an R&D instrument and the wavelength meter as a production instrument, but that distinction is too simple. In R&D, an OSA may characterize a device while a wavelength meter provides precise calibration and tuning. During design verification, both may be used to confirm that wavelength and spectral-quality requirements are met. In manufacturing, the correct instrument is the one that directly measures the parameters in the production specification, whether the requirement is SMSR, OSNR, or absolute wavelength.
Many production workflows use both instruments in complementary roles. A wavelength meter can provide fast feedback while a laser or transceiver is tuned to the target channel; an OSA can then verify SMSR, OSNR, spectral shape, side modes, or emissions. Conversely, a production line whose pass/fail criteria are entirely spectral can use a production-optimized OSA as the primary station instrument.
|
Optical Spectrum Analyzer AQ6361
|
Optical Wavelength Meter AQ6151B
|
|
|---|---|---|
| Wavelength Range | 1200 – 1700 nm, Standard 700 – 1700 nm, Extended |
1270 – 1650 nm, Standard 1200 – 1700 nm, Extended 900 – 1700 nm, Wide Range |
| Wavelength Accuracy | ±20 pm (in 1550 nm region) | ±0.3 pm @ 1550 nm (Normal mode) |
| Spectral resolution or line separation | Wavelength resolution down to 30 pm | Minimum resolvable separation is 40 pm / 5 GHz (Normal mode) |
| Similar-looking numbers describe different capabilities: OSA resolution supports spectral-shape analysis; wavelength meter separation determines when individual carrier wavelengths can be reported | ||
| Weak-feature measurement | Sensitivity: -80 dBm Stray light suppression ratio: 73 dB Close-in dynamic range: 65 dB (± 1 nm) |
Minimum input power: -40 dBm |
| The OSA is better suited to weak side modes, noise, ASE, and small signals close to a strong peak | ||
| Multiple wavelengths | Measures spectrum continuously across span | Up to 1024 wavelength components |
| Types of inputs supported | CW, modulated, pulsed | CW and modulated sources |
| Available analysis functions | SMSR, WDM (OSNR), DFB-LD, EDFA (Gain and NF), iTLA, spectrum width, etc. | Drift, FP laser, peak search |


Table 3. Comparison of AQ6361 OSA for Production and AQ6151B Optical Wavelength Meter
To illustrate how these two types of instruments deliver different capabilities, consider two Yokogawa examples designed for optical-communications production testing: the AQ6361 optical spectrum analyzer, Yokogawa’s OSA designed specifically for the requirements of production testing, and the AQ6151B optical wavelength meter.
Summary
An optical spectrum analyzer and an optical wavelength meter answer different but complementary measurement questions. When the objective is to understand spectral shape, identify weak optical components, or measure parameters such as SMSR and OSNR, an OSA provides the detailed spectral view that is required. When the primary requirement is the highly accurate measurement of one or more discrete optical wavelengths, an optical wavelength meter provides a powerful solution.
相关行业
相关产品和解决方案

AQ6151B 光波长计
横河凭借着在光测试测量领域拥有的广泛客户经验,设计出了世界上可靠性最高且广泛通用的光波长计。 AQ6150系列具有特定的技术特点,完全有能力测量光子技术应用中使用的各种设备和系统,可以说是最有效和高成效的光波长测量仪器。


获得更多专业服务